
Page 204 - Special Topic Session (STS) - Volume 1
P. 204
STS425 Arifah B. et al.
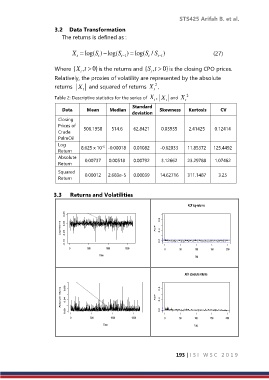
3.2 Data Transformation
The returns is defined as :
X log( ) log(S S t 1 ) log( /S S t t 1 ) (27)
t
t
Where { ,X t 0}is the returns and { ,S t 0}is the closing CPO prices.
t
t
Relatively, the proxies of volatility are represented by the absolute
2
returns X and squared of returns X ,
t
t
Table 2: Descriptive statistics for the series of X t , X t and X t 2
Standard
Data Mean Median Skewness Kurtosis CV
deviation
Closing
Prices of 506.1958 514.6 62.8421 0.03935 2.41425 0.12414
Crude
PalmOil
Log 8.625 x 10 -0.00018 0.01082 -0.62033 11.85372 125.4492
-5
Return
Absolute 0.00737 0.00518 0.00792 3.12662 23.29788 1.07462
Return
Squared 0.00012 2.683e-5 0.00039 14.62716 311.1487 3.25
Return
3.3 Returns and Volatilities
ACF log-returns
0.05
0.8
Log-returns -0.05 ACF 0.4
0.00
-0.10 0.0
0 500 1000 1500 0 50 100 150 200
Time Lag
ACF absolute returns
Absolute returns 0.08 0.04 ACF 0.8 0.4
0.00 0.0
0 500 1000 1500 0 50 100 150 200
Time Lag
193 | I S I W S C 2 0 1 9