
Page 207 - Special Topic Session (STS) - Volume 1
P. 207
STS425 Arifah B. et al.
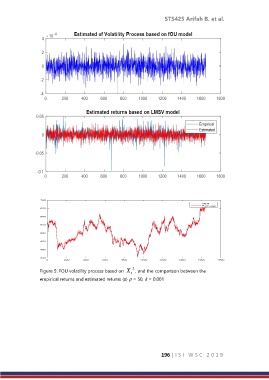
Figure 5: FOU volatility process based on X t 2 , and the comparison between the
empirical returns and estimated returns (a) p = 50, k = 0.001
196 | I S I W S C 2 0 1 9