
Page 61 - Special Topic Session (STS) - Volume 1
P. 61
STS364 Musikhin S.
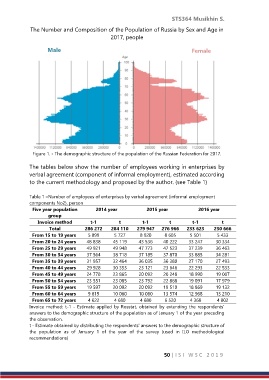
The Number and Composition of the Population of Russia by Sex and Age in
2017, people
Male Female
Figure 1. - The demographic structure of the population of the Russian Federation for 2017.
The tables below show the number of employees working in enterprises by
verbal agreement (component of informal employment), estimated according
to the current methodology and proposed by the author. (see Table 1)
Table 1 –Number of employees of enterprises by verbal agreement (informal employment
components No2), person
Five year population 2014 year 2015 year 2016 year
group
Invoice method t-1 t t-1 t t-1 t
Total 286 272 284 110 279 947 276 966 233 623 230 666
From 15 to 19 years 5 899 5 727 8 920 8 605 5 501 5 433
From 20 to 24 years 48 838 45 119 43 536 40 222 33 247 30 334
From 25 to 29 years 49 921 49 948 47 773 47 523 37 239 36 463
From 30 to 34 years 37 564 38 718 37 185 37 870 33 885 34 281
From 35 to 39 years 31 957 32 464 36 035 36 380 27 170 27 493
From 40 to 44 years 29 928 30 353 23 121 23 646 22 293 22 533
From 45 to 49 years 24 778 23 865 20 092 20 248 18 990 19 007
From 50 to 54 years 23 551 23 085 23 792 22 868 19 091 17 979
From 55 to 59 years 19 597 20 092 20 092 19 510 18 869 19 132
From 60 to 64 years 9 619 10 060 10 060 13 574 12 968 13 210
From 65 to 72 years 4 622 4 680 4 680 6 520 4 368 4 802
Invoice method: t-1 - Estimate applied by Rosstat, obtained by extending the respondents'
answers to the demographic structure of the population as of January 1 of the year preceding
the observation.
t - Estimate obtained by distributing the respondents' answers to the demographic structure of
the population as of January 1 of the year of the survey (used in ILO methodological
recommendations)
50 | I S I W S C 2 0 1 9