
Page 359 - Special Topic Session (STS) - Volume 2
P. 359
STS500 Neo S.K. et al.
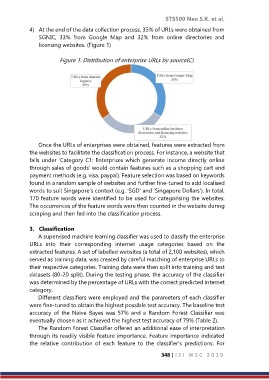
4) At the end of the data collection process, 35% of URLs were obtained from
SGNIC, 33% from Google Map and 32% from online directories and
licensing websites. (Figure 1)
Figure 1: Distribution of enterprise URLs by sourceIC).
Once the URLs of enterprises were obtained, features were extracted from
the websites to facilitate the classification process. For instance, a website that
falls under ‘Category C1: Enterprises which generate income directly online
through sales of goods’ would contain features such as a shopping cart and
payment methods (e.g. visa, paypal). Feature selection was based on keywords
found in a random sample of websites and further fine-tuned to add localised
words to suit Singapore’s context (e.g. ‘SGD’ and ‘Singapore Dollars’). In total,
170 feature words were identified to be used for categorising the websites.
The occurrences of the feature words were then counted in the website during
scraping and then fed into the classification process.
3. Classification
A supervised machine learning classifier was used to classify the enterprise
URLs into their corresponding internet usage categories based on the
extracted features. A set of labelled websites (a total of 2,100 websites), which
served as training data, was created by careful matching of enterprise URLs to
their respective categories. Training data were then split into training and test
datasets (80-20 split). During the testing phase, the accuracy of the classifier
was determined by the percentage of URLs with the correct predicted internet
category.
Different classifiers were employed and the parameters of each classifier
were fine-tuned to obtain the highest possible test accuracy. The baseline test
accuracy of the Naïve Bayes was 57% and a Random Forest Classifier was
eventually chosen as it achieved the highest test accuracy of 79% (Table 2).
The Random Forest Classifier offered an additional ease of interpretation
through its readily visible feature importance. Feature importance indicated
the relative contribution of each feature to the classifier’s predictions. For
348 | I S I W S C 2 0 1 9