
Page 36 - Special Topic Session (STS) - Volume 2
P. 36
STS452 Yang C. et al.
= ( − ) (5)
−1
Where, c is a row vector of row vector of CO2 emissions coefficients
representing CO2 emissions per unit of economic output by sector of
different sized firms.
2.2 Data source
For the convenience of the study and data availability, the original
China’s 2012 non-competitive input-output table was aggregated into 29
sectors, including 24 industrial sectors. The firm size division criteria of
different sectors is based on the ‘Statistical Dividing Method for Large,
Small and Medium-sized Micro-firms (2011)’ published by the National
Bureau of Statistics of China(NBS). The division criteria of industrial sector
are shown in Table 2, and the firms of industrial sector are divided into
three firm size types: large, medium, and small according to the indexes
of employment and revenue. Based on the firm-level data and the
economic census data, we can obtain the initial estimated value of LMS
model including intermediate flow matrix, the import matrix, the total
matrix, and the final demand matrix, respectively. After obtained all the
initial data of LMS model, then RAS method was applied to get the new
extended input-output table. Specifically, because of the firm-level data
limitation of the other sectors, some assumptions of different sized firms
are applied. So in this study, we only analyse the results of the industrial
sectors considering the data accuracy.
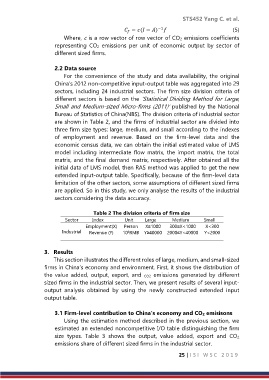
Table 2 The division criteria of firm size
Sector Index Unit Large Medium Small
Employment(X) Person X≥1000 300≤X<1000 X<300
Industrial Revenue (Y) 10 RMB Y≥40000 2000≤Y<40000 Y<2000
4
3. Results
This section illustrates the different roles of large, medium, and small-sized
firms in China’s economy and environment. First, it shows the distribution of
the value added, output, export, and CO2 emissions generated by different
sized firms in the industrial sector. Then, we present results of several input-
output analysis obtained by using the newly constructed extended input
output table.
3.1 Firm-level contribution to China’s economy and CO2 emisisons
Using the estimation method described in the previous section, we
estimated an extended noncompetitive I/O table distinguishing the firm
size types. Table 3 shows the output, value added, export and CO2
emissions share of different sized firms in the industrial sector.
25 | I S I W S C 2 0 1 9