
Page 38 - Special Topic Session (STS) - Volume 2
P. 38
STS452 Yang C. et al.
that the value-added created by per unit input of medium-sized firms is
higher than that of large-sized firms.
3.2 Roles of different sized firms in the China’s export
In this section, we use the extended Chinese input-output table, to
explore the value-added exports as well as export-embodied carbon
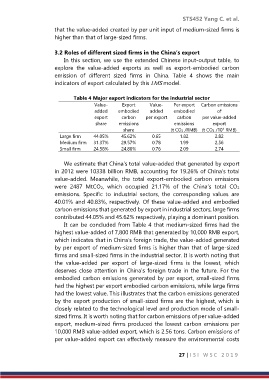
emission of different sized firms in China. Table 4 shows the main
indicators of export calculated by this LMS model.
Table 4 Major export indicators for the industrial sector
Value- Export Value- Per export Carbon emissions
added embodied added embodied of
export carbon per export carbon per value-added
share emissions emissions export
share (t CO 2 /RMB) (t CO 2 /10 RMB)
4
Large firm 44.05% 45.62% 0.65 1.82 2.82
Medium firm 31.37% 29.57% 0.78 1.99 2.56
Small firm 24.58% 24.80% 0.76 2.09 2.74
We estimate that China’s total value-added that generated by export
in 2012 were 10338 billion RMB, accounting for 19.26% of China’s total
value-added. Meanwhile, the total export-embodied carbon emissions
were 2487 MtCO2, which occupied 21.17% of the China’s total CO2
emissions. Specific to industrial sectors, the corresponding values are
40.01% and 40.83%, respectively. Of these value-added and embodied
carbon emissions that generated by export in industrial sectors, large firms
contributed 44.05% and 45.62% respectively, playing a dominant position.
It can be concluded from Table 4 that medium-sized firms had the
highest value-added of 7,800 RMB that generated by 10,000 RMB export,
which indicates that in China's foreign trade, the value-added generated
by per export of medium-sized firms is higher than that of large-sized
firms and small-sized firms in the industrial sector. It is worth noting that
the value-added per export of large-sized firms is the lowest, which
deserves close attention in China's foreign trade in the future. For the
embodied carbon emissions generated by per export, small-sized firms
had the highest per export embodied carbon emissions, while large firms
had the lowest value. This illustrates that the carbon emissions generated
by the export production of small-sized firms are the highest, which is
closely related to the technological level and production mode of small-
sized firms. It is worth noting that for carbon emissions of per value-added
export, medium-sized firms produced the lowest carbon emissions per
10,000 RMB value-added export, which is 2.56 tons. Carbon emissions of
per value-added export can effectively measure the environmental costs
27 | I S I W S C 2 0 1 9