Page 71 - Special Topic Session (STS) - Volume 2
P. 71

STS459 Norshahida S. et al.
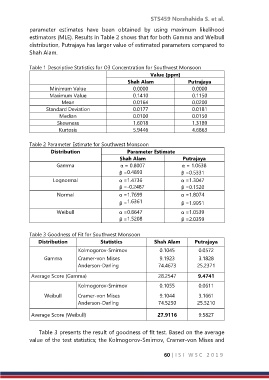
            parameter  estimates  have  been  obtained  by  using  maximum  likelihood
            estimators (MLE). Results in Table 2 shows that for both Gamma and Weibull
            distribution, Putrajaya has larger value of estimated parameters compared to
            Shah Alam.

            Table 1 Descriptive Statistics for O3 Concentration for Southwest Monsoon
                                                           Value (ppm)
                                                  Shah Alam              Putrajaya
                    Minimum Value                   0.0000                 0.0000
                    Maximum Value                   0.1410                 0.1150
                         Mean                       0.0164                 0.0200
                   Standard Deviation               0.0177                 0.0181
                        Median                      0.0100                 0.0150
                       Skewness                     1.6018                 1.3189
                        Kurtosis                    5.9446                 4.6863

            Table 2 Parameter Estimate for Southwest Monsoon
                     Distribution                 Parameter Estimate
                                               Shah Alam               Putrajaya
                       Gamma                   α = 0.8007              α = 1.0638
                                               β =  0.4893             β = 0.5331
                     Lognormal                 α =  1.4736             α =  1.3047
                                               β =  -0.2487            β = 0.1520
                       Normal                  α =  1.7699             α =  1.8074
                                               β =  1.6361             β = 1.9951

                       Weibull                 α =  0.8647             α =  1.0539
                                               β =  1.5208             β = 2.0359

            Table 3 Goodness of Fit for Southwest Monsoon
                Distribution            Statistics          Shah Alam       Putrajaya
                               Kolmogorov-Smirnov             0.1045         0.0572
                  Gamma        Cramer-von Mises               9.1923         3.1828
                               Anderson-Darling               74.4673        25.2371
             Average Score (Gamma)                            28.2547        9.4741

                               Kolmogorov-Smirnov             0.1055         0.0611
                  Weibull      Cramer-von Mises               9.1044         3.1661
                               Anderson-Darling               74.5250        25.5210
             Average Score (Weibull)                         27.9116         9.5827


                Table 3 presents the result of goodness of fit test. Based on the average
            value of the test statistics; the Kolmogorov-Smirnov, Cramer-von Mises and


                                                                60 | I S I   W S C   2 0 1 9
   66   67   68   69   70   71   72   73   74   75   76