
Page 69 - Special Topic Session (STS) - Volume 2
P. 69
STS459 Norshahida S. et al.
models that can appropriately represent O3 distribution at Shah Alam and
Putrajaya air quality monitoring sites, during dry season in Malaysia (i.e.
Southwest monsoon) and further, the model will be used to predict O3
exceedances.
2. Methodology
This study used secondary data which was obtained from the Air Quality
Division, Department of Environment (DOE) in Putrajaya, Malaysia. The data
consist of daily by hourly recorded O3 concentration for two years period of
time from 2013 to 2014 at two air quality monitoring stations; the Shah Alam
and Putrajaya stations. In this study, four probability distributions were used
to fit the hourly O3 concentration (ppm) that were recorded during dry season
which include; Gamma, Lognormal, Normal and Weibull. Due to the small
values of the observed O3, the analysis was then conducted using modified
scale values of 10 times of the observed.
The estimation of Gamma probability density function parameter
(α=shape parameter and β=scale parameter), Lognormal probability density
function parameters (α=scale parameter and β=shape parameter), Normal
probability density function parameter (α=scale parameter and β =location
parameter) and Weibull probability density function parameter (α=scale
parameter and β =shape parameter) were done using the maximum likelihood
estimators (MLE) methods. Several goodness of fit statistic was used to
determine the distribution that can give the best fit to the data. The goodness
of fit criteria or statistics includes the Kolmogrov-Smirnov, Cramer-von Mises
and Anderson-Darling. The three goodness of fit were compared and the one
with the lowest value indicate the best distribution.
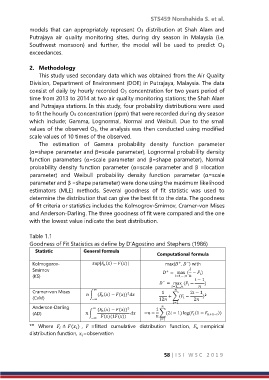
Table 1.1
Goodness of Fit Statistics as define by D’Agostino and Stephens (1986)
Statistic General formula
Computational formula
Kolmogorov- | () − ()| max( , ) with
−
+
Smirnov = max ( − )
+
(KS) =1,…, − 1
−
= max ( − )
=1,…,
Cramer-von Mises ∞ () − ()) 1 2 − 1
2
2
(CvM) ∫ ( 12 + ∑( − 2 )
−∞
=1
Anderson-Darling ∞ () − ()) 2 1
(AD) ∫ ( − − ∑(2 − 1) log( (1 − +1− ))
−∞ ()(1()) =1
** Where ≜ ( ) , =fitted cumulative distribution function, =empirical
distribution function, =observation
58 | I S I W S C 2 0 1 9