
Page 73 - Special Topic Session (STS) - Volume 2
P. 73
STS459 Norshahida S. et al.
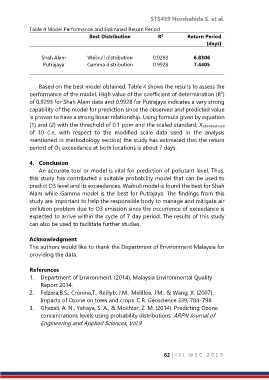
Table 4 Model Performance and Estimated Return Period
Best Distribution R Return Period
2
(days)
Shah Alam Weibull distribution 0.9293 6.8306
Putrajaya Gamma distribution 0.9928 7.4405
Based on the best model obtained, Table 4 shows the results to assess the
2
performance of the model. High value of the coefficient of determination (R )
of 0.9293 for Shah Alam data and 0.9928 for Putrajaya indicates a very strong
capability of the model for prediction since the observed and predicted value
is proven to have a strong linear relationship. Using formula given by equation
(1) and (2) with the threshold of 0.1 ppm and the scaled standard, Xstandard new
of 10 (i.e. with respect to the modified scale data used in the analysis
mentioned in methodology section) the study has estimated that the return
period of O3 exceedance at both locations is about 7 days.
4. Conclusion
An accurate tool or model is vital for prediction of pollutant level. Thus,
this study has contributed a suitable probability model that can be used to
predict O3 level and its exceedances. Waibull model is found the best for Shah
Alam while Gamma model is the best for Putrajaya. The findings from this
study are important to help the responsible body to manage and mitigate air
pollution problem due to O3 emission since the occurrence of exceedance is
expected to arrive within the cycle of 7 day period. The results of this study
can also be used to facilitate further studies.
Acknowledgment
The authors would like to thank the Department of Environment Malaysia for
providing the data.
References
1. Department of Environment. (2014). Malaysia Environmental Quality
Report 2014.
2. Felzera,B.S., Cronina,T., Reillyb, J.M., Melilloa, J.M., & Wang, X. (2007).
Impacts of Ozone on trees and crops. C.R. Geoscience 339, 784–798
3. Ghazali, A. N., Yahaya, S. A., & Mokhtar, Z. M. (2014). Predicting Ozone
concentrations levels using probability distributions. ARPN Journal of
Engineering and Applied Sciences, Vol.9
62 | I S I W S C 2 0 1 9