
Page 72 - Special Topic Session (STS) - Volume 2
P. 72
STS459 Norshahida S. et al.
Anderson-Darling, the study provides the evidence that O3 level can be best
modelled by Weibull and Gamma at Shah Alam and Putrajaya sites
respectively.
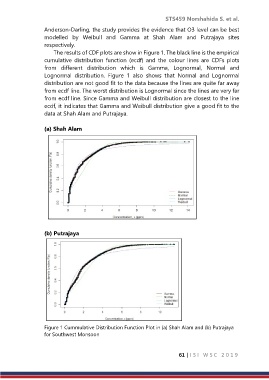
The results of CDF plots are show in Figure 1. The black line is the empirical
cumulative distribution function (ecdf) and the colour lines are CDFs plots
from different distribution which is Gamma, Lognormal, Normal and
Lognormal distribution. Figure 1 also shows that Normal and Lognormal
distribution are not good fit to the data because the lines are quite far away
from ecdf line. The worst distribution is Lognormal since the lines are very far
from ecdf line. Since Gamma and Weibull distribution are closest to the line
ecdf, it indicates that Gamma and Weibull distribution give a good fit to the
data at Shah Alam and Putrajaya.
(a) Shah Alam
(b) Putrajaya
Figure 1 Cummulative Distribution Function Plot in (a) Shah Alam and (b) Putrajaya
for Southwest Monsoon
61 | I S I W S C 2 0 1 9