
Page 372 - Special Topic Session (STS) - Volume 3
P. 372
STS550 Kyle Hood et al.
rest of the sample. Thus, if there are Τ in-sample observations, the model is
computed Τ times on Τ -1 observations, and Τ leave-one-out errors are
computed. These errors are then used to compute a sample forecast variance.
Model specifications
We have selected 12 model specifications to be supplied to each of the
model-averaging algorithms. These are further grouped into six indicator model
specifications and six factor model specifications. Within each grouping, we
consider model specifications with lags from 0 (only the contemporaneous
indicator or factor) to 4 (including the contemporaneous indicator or factor, lags
of the indicator or factor up to and including lag 4, and lags of the third estimate
up to and including lag 4). This yields 5 model specifications for each grouping.
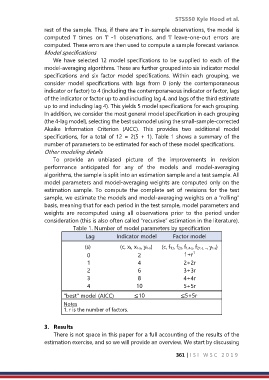
In addition, we consider the most general model specification in each grouping
(the 4-lag model), selecting the best submodel using the small-sample-corrected
Akaike Information Criterion (AICC). This provides two additional model
specifications, for a total of 12 = 2(5 + 1). Table 1 shows a summary of the
number of parameters to be estimated for each of these model specifications.
Other modeling details
To provide an unbiased picture of the improvements in revision
performance anticipated for any of the models and model-averaging
algorithms, the sample is split into an estimation sample and a test sample. All
model parameters and model-averaging weights are computed only on the
estimation sample. To compute the complete set of revisions for the test
sample, we estimate the models and model-averaging weights on a “rolling”
basis, meaning that for each period in the test sample, model parameters and
weights are recomputed using all observations prior to the period under
consideration (this is also often called “recursive” estimation in the literature).
Table 1. Number of model parameters by specification
Lag Indicator model Factor model
(s) (c, xt, xt-s, yt-s) (c, f1,t, f2,t, f1,t-s, f2,t-s, .., yt-s)
1
0 2 1+r
1 4 2+2r
2 6 3+3r
3 8 4+4r
4 10 5+5r
"best" model (AICC) ≤10 ≤5+5r
Notes
1. r is the number of factors.
3. Results
There is not space in this paper for a full accounting of the results of the
estimation exercise, and so we will provide an overview. We start by discussing
361 | I S I W S C 2 0 1 9