Page 374 - Special Topic Session (STS) - Volume 3
P. 374
STS550 Kyle Hood et al.
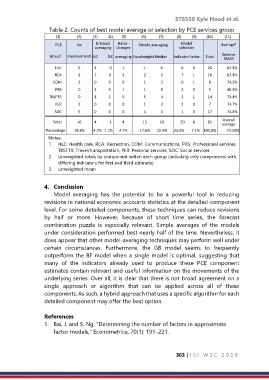
                    Table 2. Counts of best model average or selection by PCE services group
                       (1)                (2)              (3)             (4)           (5)                  (6)                (7)                (8)             (9)            (10)              (11)
                       PCE     No     IC-based   Bates-  Simple averaging   Model       Average
                                                                                           3
                                     averaging   Granger              selection
                        1
                                    2
                    Group    Improvement    AIC          BIC  averaging Equal weights Median   Indicator Factor   Total   Relative
                                                                                       RMSR
                      HLC      5       1              0   1              1                6           6          0   20   67.3%
                      RCA      2     1             0   2   2                1           7          1   16   87.4%
                     COM       2       0             0   0   1                2           0          1   6   74.2%
                      PRS      0       1             0   1   1                0           2          0   5   48.3%
                    TRSFTR     0       1             1   0   5                4           2          1   14   73.4%
                      PER      2       0             0   0   1                2           2          0   7   74.7%
                      SOC      5       0             0   0   4                4           1          3   17   73.3%
                                                                                      Overall
                     Total     16      4              1   4             15              19          20         6   85
                                                                                      average
                   Percentage   18.8%    4.7%   1.2%   4.7%          17.6%       22.4%   23.5%   7.1%  100.0%   73.20%
                    Notes:
                    1.  HLC: Health care, RCA: Recreation, COM: Communications, PRS: Professional services,
                       TRSFTR: Travel/transportation, PER: Personal services, SOC: Social services
                    2.  Unweighted totals by component within each group (including only components with
                       differing indicators for first and third estimate)
                    3.  Unweighted mean


                  4.  Conclusion
                      Model  averaging  has  the  potential  to  be  a  powerful  tool  in  reducing
                  revisions in national economic accounts statistics at the detailed-component
                  level. For some detailed components, these techniques can reduce revisions
                  by  half  or  more.  However,  because  of  short  time  series,  the  forecast
                  combination  puzzle  is  especially  relevant.  Simple  averages  of  the  models
                  under consideration performed best nearly half of the time. Nevertheless, it
                  does appear that other model-averaging techniques may perform well under
                  certain  circumstances.  Furthermore,  the  GB  model  seems  to  frequently
                  outperform the BF model when a single model is optimal, suggesting that
                  many  of  the  indicators  already  used  to  produce  these  PCE  component
                  estimates contain relevant and useful information on the movements of the
                  underlying series. Over all, it is clear that there is not broad agreement on a
                  single  approach  or  algorithm  that  can  be  applied  across  all  of  these
                  components. As such, a hybrid approach that uses a specific algorithm for each
                  detailed component may offer the best option.

                  References
                  1.  Bai, J. and S. Ng, “Determining the number of factors in approximate
                      factor models,” Econometrica, 70(1): 191–221.


                                                                     363 | I S I   W S C   2 0 1 9

