
Page 163 - Special Topic Session (STS) - Volume 4
P. 163
STS577 Md. Sabiruzzaman et al.
with an error distribution (e.g., normal, ged and t). The return series are
reconstructed with the new detail coefficients. The reconstructed return series
is then modeled with a GARCH equation and forecasted as well.
3. Illustration
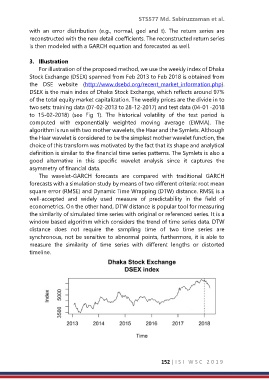
For illustration of the proposed method, we use the weekly index of Dhaka
Stock Exchange (DSEX) spanned from Feb 2013 to Feb 2018 is obtained from
the DSE website (http://www.dsebd.org/recent_market_information.php).
DSEX is the main index of Dhaka Stock Exchange, which reflects around 97%
of the total equity market capitalization. The weekly prices are the divide in to
two sets: training data (07-02-2013 to 28-12-2017) and test data (04-01 -2018
to 15-02-2018) (see Fig 1). The historical volatility of the test period is
computed with exponentially weighted moving average (EWMA). The
algorithm is run with two mother wavelets, the Haar and the Symlets. Although
the Haar wavelet is considered to be the simplest mother wavelet function, the
choice of this transform was motivated by the fact that its shape and analytical
definition is similar to the financial time series patterns. The Symlets is also a
good alternative in this specific wavelet analysis since it captures the
asymmetry of financial data.
The wavelet-GARCH forecasts are compared with traditional GARCH
forecasts with a simulation study by means of two different criteria: root mean
square error (RMSE) and Dynamic Time Wrapping (DTW) distance. RMSE is a
well-accepted and widely used measure of predictability in the field of
econometrics. On the other hand, DTW distance is popular tool for measuring
the similarity of simulated time series with original or referenced series. It is a
window based algorithm which considers the trend of time series data. DTW
distance does not require the sampling time of two time series are
synchronous, not be sensitive to abnormal points, furthermore, it is able to
measure the similarity of time series with different lengths or distorted
timeline.
152 | I S I W S C 2 0 1 9