
Page 165 - Special Topic Session (STS) - Volume 4
P. 165
STS577 Md. Sabiruzzaman et al.
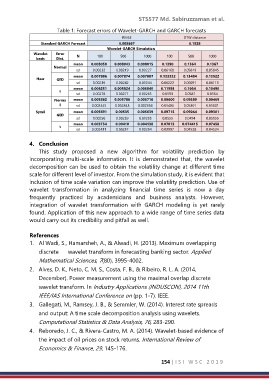
Table 1: Forecast errors of Wavelet-GARCH and GARCH forecasts
RMSE DTW distance
Standard GARCH Forecast 0.008667 0.1528
Wavelet-GARCH Simulation
Wavelet Error
basis Dist. N 100 500 1000 100 500 1000
mean 0.008058 0.008043 0.008015 0.1390 0.1364 0.1367
Normal
sd 0.00232 0.00219 0.00227 0.06168 0.05819 0.05845
mean 0.007886 0.007874 0.007887 0.133332 0.13484 0.13522
Haar GED
sd 0.00236 0.00242 0.00244 0.06222 0.06091 0.06116
mean 0.006251 0.005824 0.005840 0.11593 0.1064 0.10490
t
sd 0.00278 0.00271 0.00263 0.0593 0.0581 0.0564
Norma mean 0.005862 0.005786 0.005716 0.09600 0.09589 0.09469
l sd 0.002445 0.002343 0.002368 0.05486 0.05301 0.05301
Sym8 mean 0.005691 0.00535 0.005639 0.09715 0.09044 0.09301
GED sd 0.00250 0.00239 0.00233 0.0555 0.0494 0.05055
mean 0.003734 0.00410 0.004138 0.07015 0.074415 0.07458
t
sd 0.002431 0.00237 0.00234 0.03997 0.04528 0.04524
4. Conclusion
This study proposed a new algorithm for volatility prediction by
incorporating multi-scale information. It is demonstrated that, the wavelet
decomposition can be used to obtain the volatility change at different time
scale for different level of investor. From the simulation study, it is evident that
inclusion of time scale variation can improve the volatility prediction. Use of
wavelet transformation in analyzing financial time series is now a day
frequently practiced by academicians and business analysts. However,
integration of wavelet transformation with GARCH modeling is yet rarely
found. Application of this new approach to a wide range of time series data
would carry out its credibility and pitfall as well.
References
1. Al Wadi, S., Hamarsheh, A., & Alwadi, H. (2013). Maximum overlapping
discrete wavelet transform in forecasting banking sector. Applied
Mathematical Sciences, 7(80), 3995-4002.
2. Alves, D. K., Neto, C. M. S., Costa, F. B., & Ribeiro, R. L. A. (2014,
December). Power measurement using the maximal overlap discrete
wavelet transform. In Industry Applications (INDUSCON), 2014 11th
IEEE/IAS International Conference on (pp. 1-7). IEEE.
3. Gallegati, M., Ramsey, J. B., & Semmler, W. (2014). Interest rate spreads
and output: A time scale decomposition analysis using wavelets.
Computational Statistics & Data Analysis, 76, 283-290.
4. Reboredo, J. C., & Rivera-Castro, M. A. (2014). Wavelet-based evidence of
the impact of oil prices on stock returns. International Review of
Economics & Finance, 29, 145-176.
154 | I S I W S C 2 0 1 9