
Page 21 - Special Topic Session (STS) - Volume 4
P. 21
STS556 Nitin Kumar et al.
(1991) and Arellano and Bover (1995) has been employed to estimate casual
effect of regressor on dependent variable, formulated as follows.
The lagged endogenous variable is represented by yi, t-1 with Xi, t being
matrix of other exogenous variables as explained in previous section.
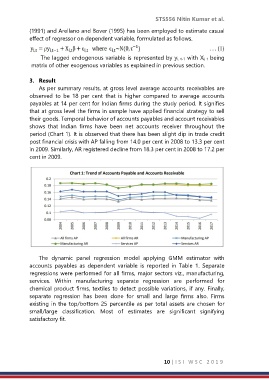
3. Result
As per summary results, at gross level average accounts receivables are
observed to be 18 per cent that is higher compared to average accounts
payables at 14 per cent for Indian firms during the study period. It signifies
that at gross level the firms in sample have applied financial strategy to sell
their goods. Temporal behavior of accounts payables and account receivables
shows that Indian firms have been net accounts receiver throughout the
period (Chart 1). It is observed that there has been slight dip in trade credit
post financial crisis with AP falling from 14.0 per cent in 2008 to 13.3 per cent
in 2009. Similarly, AR registered decline from 18.3 per cent in 2008 to 17.2 per
cent in 2009.
The dynamic panel regression model applying GMM estimator with
accounts payables as dependent variable is reported in Table 1. Separate
regressions were performed for all firms, major sectors viz., manufacturing,
services. Within manufacturing separate regression are performed for
chemical product firms, textiles to detect possible variations, if any. Finally,
separate regression has been done for small and large firms also. Firms
existing in the top/bottom 25 percentile as per total assets are chosen for
small/large classification. Most of estimates are significant signifying
satisfactory fit.
10 | I S I W S C 2 0 1 9