
Page 25 - Special Topic Session (STS) - Volume 4
P. 25
STS556 Nitin Kumar et al.
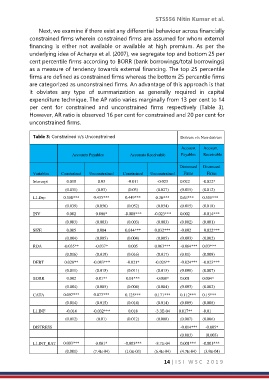
Next, we examine if there exist any differential behaviour across financially
constrained firms wherein constrained firms are assumed for whom external
financing is either not available or available at high premium. As per the
underlying idea of Acharya et al. (2007), we segregate top and bottom 25 per
cent percentile firms according to BORR (bank borrowings/total borrowings)
as a measure of tendency towards external financing. The top 25 percentile
firms are defined as constrained firms whereas the bottom 25 percentile firms
are categorized as unconstrained firms. An advantage of this approach is that
it obviates any type of summarization as generally required in capital
expenditure technique. The AP ratio varies marginally from 13 per cent to 14
per cent for constrained and unconstrained firms respectively (Table 3).
However, AR ratio is observed 16 per cent for constrained and 20 per cent for
unconstrained firms.
Table 3: Constrained v/s Unconstrained Distress v/s Non-distress
Account Account
Accounts Payables Accounts Receivable Payables Receivable
Distressed Distressed
Variables Constrained Unconstrained Constrained Unconstrained Firms Firms
Intercept 0.018 0.03 -0.011 -0.023 0.022 -0.022*
(0.031) (0.03) (0.03) (0.027) (0.015) (0.012)
L1.Dep 0.358*** 0.435*** 0.449*** 0.36*** 0.63*** 0.555***
(0.039) (0.056) (0.052) (0.054) (0.015) (0.018)
INV 0.002 0.006* -0.008*** -0.023*** 0.002 -0.014***
(0.003) (0.003) (0.003) (0.003) (0.002) (0.001)
SIZE 0.005 0.004 0.014*** 0.032*** -0.002 0.022***
(0.004) (0.005) (0.004) (0.005) (0.003) (0.002)
ROA -0.035** -0.037* 0.005 0.063*** -0.064*** 0.03***
(0.016) (0.019) (0.016) (0.017) (0.01) (0.009)
DEBT 0.028** -0.083*** -0.021* -0.026** -0.024*** -0.023***
(0.011) (0.015) (0.011) (0.013) (0.008) (0.007)
BORR 0.002 0.01** 0.01*** -0.008* 0.001 0.004*
(0.004) (0.005) (0.004) (0.004) (0.003) (0.002)
CATA 0.097*** 0.077*** 0.125*** 0.171*** 0.112*** 0.15***
(0.014) (0.015) (0.014) (0.014) (0.009) (0.008)
L1.INF -0.014 -0.032*** 0.018 -3.3E-04 0.017** -0.01
(0.012) (0.01) (0.012) (0.008) (0.007) (0.006)
DISTRESS -0.014*** -0.005*
(0.003) (0.003)
L1.INT_RAT 0.003*** 0.001* -0.003*** -8.7E-04 0.001*** -0.001***
E (0.001) (7.4E-04) (1.0E-03) (6.4E-04) (4.7E-04) (3.9E-04)
14 | I S I W S C 2 0 1 9