
Page 24 - Special Topic Session (STS) - Volume 4
P. 24
STS556 Nitin Kumar et al.
(0.009) (0.01) (0.021) (0.023) (0.019) (0.015) (0.017)
DEBT -0.022*** -0.021*** -0.039** -0.035* 0.002 -0.02* -0.003
(0.007) (0.007) (0.02) (0.021) (0.012) (0.012) (0.012)
BORR 0.004* 0.004 -0.003 7.7E-04 0.012** 0.001 -6.7E-04
(0.002) (0.003) (0.006) (0.006) (0.006) (0.004) (0.004)
CATA 0.15*** 0.164*** 0.092*** 0.197*** 0.117*** 0.255*** 0.073***
(0.008) (0.009) (0.016) (0.019) (0.018) (0.016) (0.012)
L1.INF -0.005* -0.006** -0.008 -0.025*** 0.003 -0.015 0.003
(0.003) (0.003) (0.008) (0.007) (0.006) (0.009) (0.005)
L1.INT_RATE -0.001*** -0.001** -0.001 7.3E-04 6.0E-04 -0.004*** -0.002***
(3.9E-04) (4.2E-04) (0.001) (0.001) (9.0E-04) (0.001) (6.1E-04)
L1.GR_RATE -0.002*** -0.002*** -6.9E-04 -0.002* 0.002** -2.0E-04 -0.001**
(4.2E-04) (4.6E-04) (0.001) (0.001) (0.001) (0.001) (6.7E-04)
Wald Statistics 1992*** 1633*** 184*** 323*** 365*** 428*** 533***
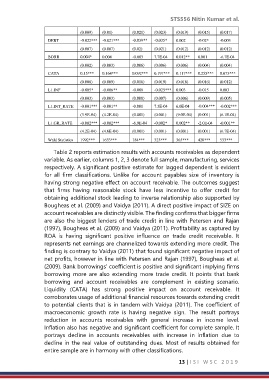
Table 2 reports estimation results with accounts receivables as dependent
variable. As earlier, columns 1, 2, 3 denote full sample, manufacturing, services
respectively. A significant positive estimate for lagged dependent is evident
for all firm classifications. Unlike for account payables size of inventory is
having strong negative effect on account receivable. The outcomes suggest
that firms having reasonable stock have less incentive to offer credit for
obtaining additional stock leading to inverse relationship also supported by
Bougheas et al. (2009) and Vaidya (2011). A direct positive impact of SIZE on
account receivables are distinctly visible. The finding confirms that bigger firms
are also the biggest lenders of trade credit in line with Petersen and Rajan
(1997), Bougheas et al. (2009) and Vaidya (2011). Profitability as captured by
ROA is having significant positive influence on trade credit receivable. It
represents net earnings are channelized towards extending more credit. The
finding is contrary to Vaidya (2011) that found significant negative impact of
net profits, however in line with Petersen and Rajan (1997), Bougheas et al.
(2009). Bank borrowings’ coefficient is positive and significant implying firms
borrowing more are also extending more trade credit. It points that bank
borrowing and account receivables are complement in existing scenario.
Liquidity (CATA) has strong positive impact on account receivable. It
corroborates usage of additional financial resources towards extending credit
to potential clients that is in tandem with Vaidya (2011). The coefficient of
macroeconomic growth rate is having negative sign. The result portrays
reduction in accounts receivables with general increase in income level.
Inflation also has negative and significant coefficient for complete sample. It
portrays decline in accounts receivables with increase in inflation due to
decline in the real value of outstanding dues. Most of results obtained for
entire sample are in harmony with other classifications.
13 | I S I W S C 2 0 1 9