
Page 116 - Contributed Paper Session (CPS) - Volume 2
P. 116
CPS1447 Russasmita S.P. et al.
Instead, the students kept the modal values in their original frequency and
added dots around it (Figure 1). They were more concerned with being fair
and filling in the empty space to make the dot plot appear more ‘even’.
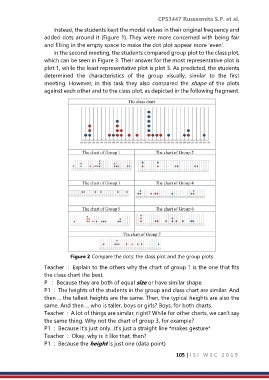
In the second meeting, the students compared group plot to the class plot,
which can be seen in Figure 3. Their answer for the most representative plot is
plot 1, while the least representative plot is plot 3. As predicted, the students
determined the characteristics of the group visually, similar to the first
meeting. However, in this task they also compared the shape of the plots
against each other and to the class plot, as depicted in the following fragment.
Figure 2 Compare the dots: the class plot and the group plots
Teacher : Explain to the others why the chart of group 1 is the one that fits
the class chart the best.
P : Because they are both of equal size or have similar shape.
P1 : The heights of the students in the group and class chart are similar. And
then ... the tallest heights are the same. Then, the typical heights are also the
same. And then ... who is taller, boys or girls? Boys, for both charts.
Teacher : A lot of things are similar, right? While for other charts, we can’t say
the same thing. Why not the chart of group 3, for example?
P1 : Because it’s just only...it’s just a straight line *makes gesture*
Teacher : Okay, why is it like that, then?
P1 : Because the height is just one (data point)
105 | I S I W S C 2 0 1 9