
Page 299 - Contributed Paper Session (CPS) - Volume 2
P. 299
CPS1863 La Gubu et al.
Based on portfolio weights, mean vectors and covariance matrices, we can
then determine the return, risk and Sharpe ratio of the two portfolio models
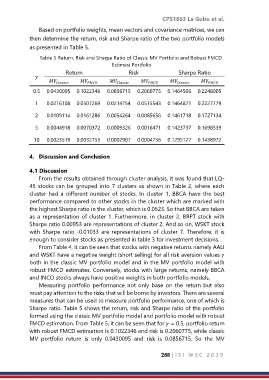
as presented in Table 5.
Table 5 Return, Risk and Sharpe Ratio of Classic MV Portfolio and Robust FMCD
Estimasi Portfolio
Return Risk Sharpe Ratio
0.5 0.0430095 0.1022346 0.0856715 0.2060775 0.1464506 0.2248905
1 0.0216108 0.0507269 0.0214754 0.0515543 0.1464871 0.2227779
2 0.0109114 0.0161286 0.0054264 0.0085656 0.1461718 0.1727134
5 0.0044918 0.0070372 0.0009326 0.0016471 0.1423737 0.1698539
10 0.0023519 0.0032753 0.0002907 0.0004736 0.1295127 0.1438972
4. Discussion and Conclusion
4.1 Discussion
From the results obtained through cluster analysis, it was found that LQ-
45 stocks can be grouped into 7 clusters as shown in Table 2, where each
cluster had a different number of stocks. In cluster 1, BBCA have the best
performance compared to other stocks in the cluster which are marked with
the highest Sharpe ratio in the cluster, which is 0.0523. So that BBCA are taken
as a representation of cluster 1. Furthermore, in cluster 2, BRPT stock with
Sharpe ratio 0.00953 are representations of cluster 2. And so on, WSKT stock
with Sharpe ratio -0.01033 are representations of cluster 7. Therefore, it is
enough to consider stocks as presented in table 3 for investment decisions.
From Table 4, it can be seen that stocks with negative returns namely AALI
and WSKT have a negative weight (short selling) for all risk aversion values
both in the classic MV portfolio model and in the MV portfolio model with
robust FMCD estimates. Conversely, stocks with large returns, namely BBCA
and INCO stocks always have positive weights in both portfolio models.
Measuring portfolio performance not only base on the return but also
must pay attention to the risks that will be borne by investors. There are several
measures that can be used to measure portfolio performance, one of which is
Sharpe ratio. Table 5 shows the return, risk and Sharpe ratio of the portfolio
formed using the classic MV portfolio model and portfolio model with robust
FMCD estimation. From Table 5, it can be seen that for = 0.5, portfolio return
with robust FMCD estimation is 0.1022346 and risk is 0.2060775, while classic
MV portfolio return is only 0.0430095 and risk is 0.0856715. So the MV
288 | I S I W S C 2 0 1 9