
Page 297 - Contributed Paper Session (CPS) - Volume 2
P. 297
CPS1863 La Gubu et al.
3. Result
3.1 Stocks Data
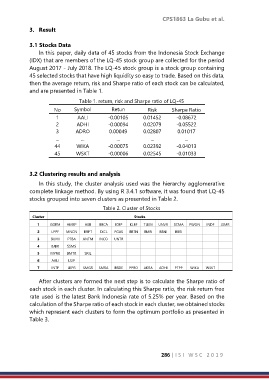
In this paper, daily data of 45 stocks from the Indonesia Stock Exchange
(IDX) that are members of the LQ-45 stock group are collected for the period
August 2017 - July 2018. The LQ-45 stock group is a stock group containing
45 selected stocks that have high liquidity so easy to trade. Based on this data,
then the average return, risk and Sharpe ratio of each stock can be calculated,
and are presented in Table 1.
Table 1. return, risk and Sharpe ratio of LQ-45
No Symbol Retun Risk Sharpe Ratio
1 AALI -0.00105 0.01452 -0.08672
2 ADHI -0.00094 0.02079 -0.05522
3 ADRO 0.00049 0.02807 0.01017
... ... ... ... ...
44 WIKA -0.00075 0.02392 -0.04013
45 WSKT -0.00006 0.02545 -0.01033
3.2 Clustering results and analysis
In this study, the cluster analysis used was the hierarchy agglomerative
complete linkage method. By using R 3.4.1 software, it was found that LQ-45
stocks grouped into seven clusters as presented in Table 2.
Table 2. Cluster of Stocks
Cluster Stocks
1 GGRM HMSP ASII BBCA ICBP KLBF TLKM UNVR SCMA PWON INDF JSMR
2 LPPF MNCN BRPT EXCL PGAS BBTN BMRI BBNI BBRI
3 BUMI PTBA ANTM INCO UNTR
4 BJBR SSMS
5 MYRX BMTR SRIL
6 AALI LSIP
7 INTP LKPR SMGR SMRA BSDE PPRO AKRA ADHI PTPP WIKA WSKT
After clusters are formed the next step is to calculate the Sharpe ratio of
each stock in each cluster. In calculating this Sharpe ratio, the risk return free
rate used is the latest Bank Indonesia rate of 5.25% per year. Based on the
calculation of the Sharpe ratio of each stock in each cluster, we obtained stocks
which represent each clusters to form the optimum portfolio as presented in
Table 3.
286 | I S I W S C 2 0 1 9