
Page 294 - Contributed Paper Session (CPS) - Volume 2
P. 294
CPS1863 La Gubu et al.
Cluster Stock 1
1
1 Data
Sharpe
Clastering Cluster Ratio Stock 2 2 Optimal
Stocks Portfolio
... ...
Cluster Stock n
Data
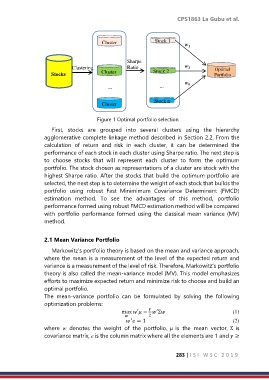
Figure 1 Optimal portfolio selection
process
First, stocks are grouped into several clusters using the hierarchy
agglomerative complete linkage method described in Section 2.2. From the
calculation of return and risk in each cluster, it can be determined the
performance of each stock in each cluster using Sharpe ratio. The next step is
to choose stocks that will represent each cluster to form the optimum
portfolio. The stock chosen as representations of a cluster are stock with the
highest Sharpe ratio. After the stocks that build the optimum portfolio are
selected, the next step is to determine the weight of each stock that builds the
portfolio using robust Fast Minimimum Covariance Determinant (FMCD)
estimation method. To see the advantages of this method, portfolio
performance formed using robust FMCD estimation method will be compared
with portfolio performance formed using the classical mean variance (MV)
method.
2.1 Mean Variance Portfolio
Markowitz's portfolio theory is based on the mean and variance approach,
where the mean is a measurement of the level of the expected return and
variance is a measurement of the level of risk. Therefore, Markowitz's portfolio
theory is also called the mean-variance model (MV). This model emphasizes
efforts to maximize expected return and minimize risk to choose and build an
optimal portfolio.
The mean-variance portfolio can be formulated by solving the following
optimization problems:
max ′ − ′Σ (1)
2
′
= 1 (2)
where w denotes the weight of the portfolio, is the mean vector, Σ is
covariance matrix, e is the column matrix where all the elements are 1 and ≥
283 | I S I W S C 2 0 1 9