Page 298 - Contributed Paper Session (CPS) - Volume 2
P. 298

CPS1863 La Gubu et al.
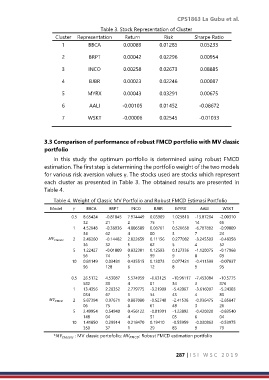
                                        Table 3. Stock Representation of Cluster
                      Cluster  Representation    Return         Risk        Sharpe Ratio
                         1         BBCA         0.00089       0.01285         0.05233

                         2         BRPT         0.00042       0.02296         0.00954

                         3         INCO         0.00258       0.02673         0.08885

                         4         BJBR         0.00023       0.02246         0.00087

                         5         MYRX         0.00043       0.03291         0.00675
                         6         AALI         -0.00105      0.01452        -0.08672

                         7         WSKT         -0.00006      0.02545        -0.01033


                  3.3 Comparison of performance of robust FMCD portfolio with MV classic
                  portfolio
                      In  this  study  the  optimum  portfolio  is  determined  using  robust  FMCD
                  estimation. The first step is determining the portfolio weight of the two models
                  for various risk aversion values γ. The stocks used are stocks which represent
                  each cluster as presented in Table 3. The obtained results are presented in
                  Table 4.

                      Table 4. Weight of Classic MV Portfolio and Robust FMCD Estimasi Portfolio
                    Model       BBCA     BRPT    INCO     BJBR    MYRX      AALI    WSKT
                            0.5   8.65424  -0.81845  7.974449  0.03969  1.025810  -13.87264  -2.00310
                                 32       21      2        75      1        14       66
                             1   4.52648  -0.36936  4.006589  0.08761  0.526658  -6.787882  -0.99009
                                 34       62      4        00      3        7        24
                         2   2.46260  -0.14482  2.022659  0.11156  0.277082  -3.245503  -0.48358
                                 36       32      5        62      5        4        52
                             5   1.22427  -0.01009  0.832301  0.12593  0.127336  -1.120075  -0.17968
                                 56       74      5        99      9        8        09
                             10   0.81149  0.03481  0.435515  0.13073  0.077421  -0.411599  -0.07837
                                 96       128     6        12      8        9        95

                            0.5   26.5172  4.53087  5.574959  -6.63125  -10.96117 -7.453084  -10.5775
                                 582      83      4        01      34       3        876
                             1   13.4356  2.28352  2.779775  -3.21909  -5.42067  -3.616097  -5.24303
                                 034      67      3        54      43       4        83
                         2   5.87394  0.97671  0.887080  -0.52740  -2.41538  -0.936475  -2.85847
                                 06       75      8        61      48       3        26
                             5   2.49954  0.54940  0.456122  -0.01991  -1.22892  -0.420828  -0.83540
                                 148      04      4        51      03       6        04
                             10   1.41850  0.29914  0.218470  0.19410  -0.55959  -0.030863  -0.53975
                                 350      37      1        29      83       9        79
                      *   : MV classic portofolio;   : Robust FMCD estimation portfolio


                                                                     287 | I S I   W S C   2 0 1 9
   293   294   295   296   297   298   299   300   301   302   303