
Page 308 - Contributed Paper Session (CPS) - Volume 2
P. 308
CPS1871 Natividad J.M. et al.
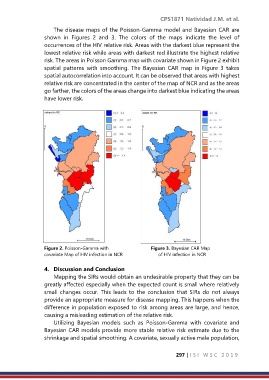
The disease maps of the Poisson-Gamma model and Bayesian CAR are
shown in Figures 2 and 3. The colors of the maps indicate the level of
occurrences of the HIV relative risk. Areas with the darkest blue represent the
lowest relative risk while areas with darkest red illustrate the highest relative
risk. The areas in Poisson Gamma map with covariate shown in Figure 2 exhibit
spatial patterns with smoothing. The Bayesian CAR map in Figure 3 takes
spatial autocorrelation into account. It can be observed that areas with highest
relative risk are concentrated in the center of the map of NCR and as the areas
go farther, the colors of the areas change into darkest blue indicating the areas
have lower risk.
Figure 2. Poisson-Gamma with Figure 3. Bayesian CAR Map
covariate Map of HIV infection in NCR of HIV infection in NCR
4. Discussion and Conclusion
Mapping the SIRs would obtain an undesirable property that they can be
greatly affected especially when the expected count is small where relatively
small changes occur. This leads to the conclusion that SIRs do not always
provide an appropriate measure for disease mapping. This happens when the
difference in population exposed to risk among areas are large, and hence,
causing a misleading estimation of the relative risk.
Utilizing Bayesian models such as Poisson-Gamma with covariate and
Bayesian CAR models provide more stable relative risk estimate due to the
shrinkage and spatial smoothing. A covariate, sexually active male population,
297 | I S I W S C 2 0 1 9