
Page 332 - Contributed Paper Session (CPS) - Volume 2
P. 332
CPS1876 Sarbojit R. et al.
given choices of and , we define the dissimilarity between a test point Z
and an observation 0 for a fixed 1 ≤ ≤ as follows:
0
1
2, (, ) = ∑ | (, ) − ( , )|. (3)
− 1 0 0
0
1≤≠ 0 ≤
Instead of looking at the Euclidean distance, which is the case for MADD,
we now consider Mean Absolute Difference of Generalized Distances
(gMADD) based on the general distance function defined in equation (2).
Clearly, one can see that we get back 1, (stated in equation (1)) by choosing
1
() = (t) and () = 2.
We denote the NN classifier based on the transformations 1, and 2,
by 1, and 2, , respectively, for a fixed ∈ ℕ. The misclassification
probabilities of the classifier is defined as follows:
,
∆ , = [ () ≠ ] for = 1,2.
2,
Recall Examples 1 and 2 discussed in Section 1. Consider = =
1
2
1/2 and generate 100 (50 + 50) training and 500 (250 + 250) test
observations. We plot the estimated values of the Bayes risk, and the
misclassification rates ∆ , ∆ and ∆ based on 100 replications for =
1,
2,
5; 10; 50; 100; 250; 500; 1000 and = 1. For the rest of this article, we
consider () = and three choices of the function () , namely, 1 −
⁄
−1 2 , √/2 and (/(1 + )) for ≥ 0 . The first choice of is uniformly
bounded, i.e., 0 ≤ () ≤ 1 for all ≥ 0. However, throughout this article, we
report misclassification rates of NN-gMADD ( ) based on since it
1
2
1
outperformed and .
3
2
(1) (2) 5
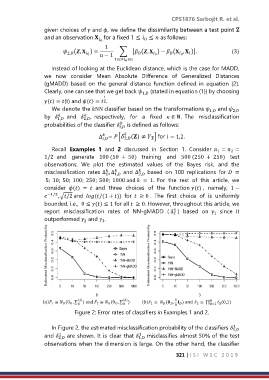
() 1 ≡ (0 , ∑ ) and 2 ≡ (0 , ∑ ) () 1 ≡ ( , ) and 2 ≡ ∏ 5 (0,1)
3 =1
Figure 2: Error rates of classifiers in Examples 1 and 2.
1
In Figure 2, the estimated misclassification probability of the classifiers 1,
1
1
and 2, are shown. It is clear that 1, misclassifies almost 50% of the test
observations when the dimension is large. On the other hand, the classifier
321 | I S I W S C 2 0 1 9