
Page 347 - Contributed Paper Session (CPS) - Volume 2
P. 347
CPS1879 Zineb El O.T.
3. Result
In this paper the empirical analysis is based on the 2014 Population and
Housing Census of Morocco, we consider the total populations of disabled
and non-disabled as the standard population, In general, the greater the
difference between the age distributions of the standard population and the
study population, the greater the difference in the crude and adjusted rates
for the study population.
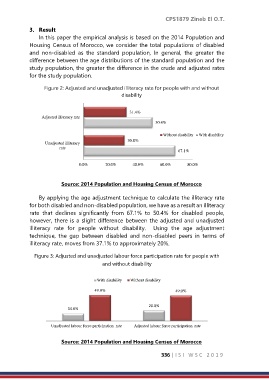
Figure 2: Adjusted and unadjusted illiteracy rate for people with and without
disability
31.4%
Adjusted illiteracy rate
50.4%
Without disability With disability
30.0%
Unadjusted illiteracy
rate
67.1%
0.0% 20.0% 40.0% 60.0% 80.0%
Source: 2014 Population and Housing Census of Morocco
By applying the age adjustment technique to calculate the illiteracy rate
for both disabled and non-disabled population, we have as a result an illiteracy
rate that declines significantly from 67.1% to 50.4% for disabled people,
however, there is a slight difference between the adjusted and unadjusted
illiteracy rate for people without disability. Using the age adjustment
technique, the gap between disabled and non-disabled peers in terms of
illiteracy rate, moves from 37.1% to approximately 20%.
Figure 3: Adjusted and unadjusted labour force participation rate for people with
and without disability
With disability Without disability
49.9% 49.0%
20.0%
14.6%
Unadjusted labour force participation rate Adjusted labour force participation rate
Source: 2014 Population and Housing Census of Morocco
336 | I S I W S C 2 0 1 9