Page 342 - Contributed Paper Session (CPS) - Volume 2
P. 342

CPS1878 Zakir H. et al.
                                                                      2
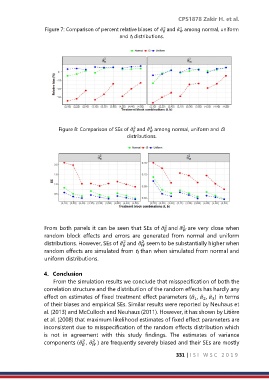
                  Figure 7: Comparison of percent relative biases of ̂ and ̂ among normal, uniform
                                                                2
                                                               
                                                                      
                                               and t3 distributions.


                       Figure 8: Comparison of SEs of ̂ and ̂ among normal, uniform and t3
                                                    2
                                                           2
                                                          
                                                    
                                                  distributions.


                                                                       2
                                                                2
                  From both panels it can be seen that SEs of ̂ and ̂ are very close when
                                                                       
                                                                
                  random  block  effects  and  errors  are  generated  from  normal  and  uniform
                  distributions. However, SEs of ̂ and ̂ seem to be substantially higher when
                                                2
                                                       2
                                                       
                                                
                  random effects are simulated from t3 than when simulated from normal and
                  uniform distributions.

                  4.  Conclusion
                     From the simulation results we conclude that misspecification of both the
                  correlation structure and the distribution of the random effects has hardly any
                  effect on estimates of fixed treatment effect parameters (̂ , ̂ , ̂ ) in terms
                                                                               2
                                                                            1
                                                                                  3
                  of their biases and empirical SEs. Similar results were reported by Neuhaus et
                  al. (2013) and McCulloch and Neuhaus (2011). However, it has shown by Litière
                  et al. (2008) that maximum likelihood estimates of fixed effect parameters are
                  inconsistent due to misspecification of the random effects distribution which
                  is  not  in  agreement  with  this  study  findings.  The  estimates  of  variance
                                     2
                                 2
                  components (̂ , ̂ ) are frequently severely biased and their SEs are mostly
                                    
                                
                                                                     331 | I S I   W S C   2 0 1 9
   337   338   339   340   341   342   343   344   345   346   347