Page 378 - Contributed Paper Session (CPS) - Volume 2
P. 378

CPS1889 Subanar
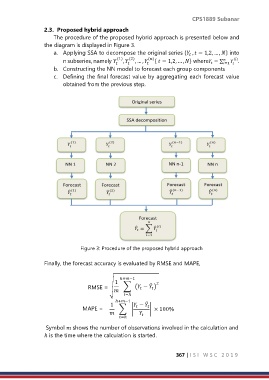
                  2.3.  Proposed hybrid approach
                      The procedure of the proposed hybrid approach is presented below and
                  the diagram is displayed in Figure 3.
                      a.  Applying SSA to decompose the original series { ,  = 1,2, … , } into
                                                                          
                                              (1)  (2)    ()                             ()
                         n subseries, namely    ,    , … ,    {  = 1,2, … , } where = ∑    .
                                                                                  
                                                                                       =1
                                                                                          
                      b.  Constructing the NN model to forecast each group components
                      c.  Defining the final forecast value by aggregating each forecast value
                         obtained from the previous step.


                                Figure 3: Procedure of the proposed hybrid approach

                  Finally, the forecast accuracy is evaluated by RMSE and MAPE,


                                               ℎ+−1
                                             1               2
                                                           ̂
                                   RMSE =  √    ∑ ( −  )


                                                =ℎ
                                             ℎ+−1      ̂
                                 MAPE =    1   ∑ |   −   | × 100%
                                                     
                                                     
                                               =ℎ
                   Symbol  shows the number of observations involved in the calculation and
                  ℎ is the time where the calculation is started.


                                                                     367 | I S I   W S C   2 0 1 9
   373   374   375   376   377   378   379   380   381   382   383