
Page 82 - Contributed Paper Session (CPS) - Volume 2
P. 82
CPS1437 Thanyani M.
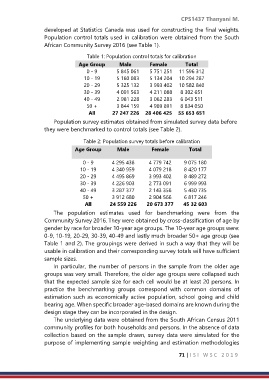
developed at Statistics Canada was used for constructing the final weights.
Population control totals used in calibration were obtained from the South
African Community Survey 2016 (see Table 1).
Table 1: Population control totals for calibration
Age Group Male Female Total
0 - 9 5 845 061 5 751 251 11 596 312
10 - 19 5 160 083 5 134 204 10 294 287
20 - 29 5 325 132 3 993 402 10 582 840
30 - 39 4 091 563 4 211 088 8 302 651
40 - 49 2 981 228 3 062 283 6 043 511
50 + 3 844 159 4 989 891 8 834 050
All 27 247 226 28 406 425 55 653 651
Population survey estimates obtained from simulated survey data before
they were benchmarked to control totals (see Table 2).
Table 2: Population survey totals before calibration
Age Group Male Female Total
0 - 9 4 295 438 4 779 742 9 075 180
10 - 19 4 340 959 4 079 218 8 420 177
20 - 29 4 495 869 3 993 402 8 489 272
30 - 39 4 226 903 2 773 091 6 999 993
40 - 49 3 287 377 2 143 358 5 430 735
50 + 3 912 680 2 904 566 6 817 246
All 24 559 226 20 673 377 45 32 603
The population estimates used for benchmarking were from the
Community Survey 2016. They were obtained by cross-classification of age by
gender by race for broader 10-year age groups. The 10-year age groups were:
0-9, 10-19, 20-29, 30-39, 40-49 and lastly much broader 50+ age group (see
Table 1 and 2). The groupings were derived in such a way that they will be
usable in calibration and their corresponding survey totals will have sufficient
sample sizes.
In particular, the number of persons in the sample from the older age
groups was very small. Therefore, the older age groups were collapsed such
that the expected sample size for each cell would be at least 20 persons. In
practice the benchmarking groups correspond with common domains of
estimation such as economically active population, school going and child
bearing age. When specific broader age-based domains are known during the
design stage they can be incorporated in the design.
The underlying data were obtained from the South African Census 2011
community profiles for both households and persons. In the absence of data
collection based on the sample drawn, survey data were simulated for the
purpose of implementing sample weighting and estimation methodologies
71 | I S I W S C 2 0 1 9