
Page 83 - Contributed Paper Session (CPS) - Volume 2
P. 83
CPS1437 Thanyani M.
for the complex survey sample design (CSSD). Statistics South Africa published
Census 2011 unit record data at SAL level. Data are made available through
SuperCROSS software which is a family of SuperSTAR Suite applications
developed by the Australian based Space Time Research. The software allows
downloading of records. However, records were without addresses and other
identifiers.
The resulting files do not exactly give details of one individual or one
household, but the records represent a group of persons or households with
given characteristics. Without identifiers of the exact persons and household
characteristics, it was not possible to obtain the direct match between persons
and households. Although maximum matches could not be achieved with
certainty, few available variables were used to match persons to households.
There was information about the household-head which was also available in
person-level file. The common variables included demographics, geography,
level of education, school attendance and language.
The results below illustrate the results of applying linear programming
method in calibration. There were two sets of constraints created, one at
national-level and the other at provincial-level. In this paper the auxiliary
totals were created from the large sample survey carried out in South Africa
called the community survey done in 2016. The cells were simply the
demographic variables (age, race and gender) and geography variable
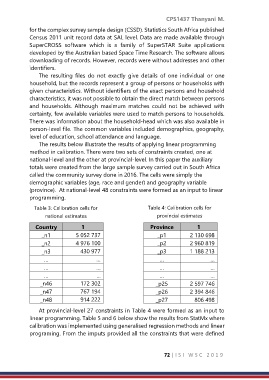
(province). At national-level 48 constraints were formed as an input to linear
programming.
Table 3: Calibration cells for Table 4: Calibration cells for
national estimates provincial estimates
Country 1 Province 1
_n1 5 052 737 _p1 2 130 698
_n2 4 976 100 _p2 2 960 819
_n3 430 977 _p3 1 188 213
… … … …
… … … …
… ... … …
_n46 172 302 _p25 2 597 746
_n47 767 194 _p26 2 394 846
_n48 914 222 _p27 806 498
At provincial-level 27 constraints in Table 4 were formed as an input to
linear programming. Table 5 and 6 below show the results from StatMx where
calibration was implemented using generalised regression methods and linear
programing. From the imputs provided all the constraints that were defined
72 | I S I W S C 2 0 1 9