
Page 177 - Contributed Paper Session (CPS) - Volume 4
P. 177
CPS2166 Divo Dharma Silalahi et al.
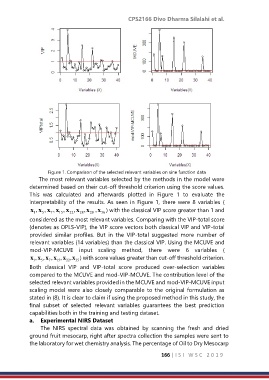
Figure 1. Comparison of the selected relevant variables on sine function data
The most relevant variables selected by the methods in the model were
determined based on their cut-off threshold criterion using the score values.
This was calculated and afterwards plotted in Figure 1 to evaluate the
interpretability of the results. As seen in Figure 1, there were 8 variables (
x , x , x , x , x ,x ,x ,x ) with the classical VIP score greater than 1 and
1 5 7 15 22 28 29 36
considered as the most relevant variables. Comparing with the VIP-total score
(denotes as OPLS-VIP), the VIP score vectors both classical VIP and VIP-total
provided similar profiles. But in the VIP-total suggested more number of
relevant variables (14 variables) than the classical VIP. Using the MCUVE and
mod-VIP-MCUVE input scaling method, there were 6 variables (
x 1 , x 5 , x 7 , x 15 , x 22 ,x ) with score values greater than cut-off threshold criterion.
35
Both classical VIP and VIP-total score produced over-selection variables
compared to the MCUVE and mod-VIP-MCUVE. The contribution level of the
selected relevant variables provided in the MCUVE and mod-VIP-MCUVE input
scaling model were also closely comparable to the original formulation as
stated in (8). It is clear to claim if using the proposed method in this study, the
final subset of selected relevant variables guarantees the best prediction
capabilities both in the training and testing dataset.
a. Experimental NIRS Dataset
The NIRS spectral data was obtained by scanning the fresh and dried
ground fruit mesocarp, right after spectra collection the samples were sent to
the laboratory for wet chemistry analysis. The percentage of Oil to Dry Mesocarp
166 | I S I W S C 2 0 1 9