
Page 178 - Contributed Paper Session (CPS) - Volume 4
P. 178
CPS2166 Divo Dharma Silalahi et al.
(%ODM) observed in the wet chemistry analysis. The %ODM with range
56 . 38 , 86 9 . and standard deviation 5.124 was used as dependent variable in
the analysis. In this study, the PLSR analysis was performed with case a single
vector of dependent variable y and processed separately. Total of 960
observations and 488 wavelengths (in the range 550-2500nm) of NIR spectral
dataset of fresh mesocarp were used in the analysis. These wavelengths are
primarily attributed to the overtone or combination bands of C-H (Fats, Oil,
Hydrocarbons), O-H (Water, Alcohol) and N-H (Protein) (Stuart, 2004). This fresh
mesocarp sample should be dried and ground before it was sent to the
laboratory for conventional soxhlet extraction to get its wet chemistry value
such %ODM. In the raw spectra the higher spectral absorbance shows the higher
%ODM, while the lower spectral absorbance shows the lower %ODM contained
in the fresh fruit mesocarp. Here the importance of the wavelengths was
generally unknown and need to be investigated.
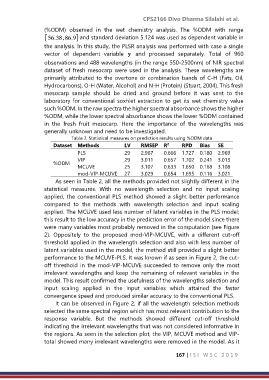
Table 2. Statistical measures on prediction results using %ODM data
Dataset Methods LV RMSEP R RPD Bias SE
2
PLS 29 2.967 0.666 1.727 0.180 2.969
VIP 29 3.011 0.657 1.702 0.241 3.013
%ODM
MCUVE 25 3.107 0.633 1.650 0.168 3.108
mod-VIP-MCUVE 27 3.029 0.654 1.695 0.116 3.021
As seen in Table 2, all the methods provided not slightly different in the
statistical measures. With no wavelength selection and no input scaling
applied, the conventional PLS method showed a slight better performance
compared to the methods with wavelength selection and input scaling
applied. The MCUVE used less number of latent variables in the PLS model;
this result to the low accuracy in the prediction error of the model since there
were many variables most probably removed in the computation (see Figure
2). Oppositely to the proposed mod-VIP-MCUVE, with a different cut-off
threshold applied in the wavelength selection and also with less number of
latent variables used in the model, the method still provided a slight better
performance to the MCUVE-PLS. It was known if as seen in Figure 2, the cut-
off threshold in the mod-VIP-MCUVE succeeded to remove only the most
irrelevant wavelengths and keep the remaining of relevant variables in the
model. This result confirmed the usefulness of the wavelengths selection and
input scaling applied in the input variables which attained the faster
convergence speed and produced similar accuracy to the conventional PLS.
It can be observed in Figure 2, if all the wavelength selection methods
selected the same spectral region which has most relevant contribution to the
response variable. But the methods showed different cut-off threshold
indicating the irrelevant wavelengths that was not considered informative in
the regions. As seen in the selection plot, the VIP, MCUVE method and VIP-
total showed many irrelevant wavelengths were removed in the model. As it
167 | I S I W S C 2 0 1 9