
Page 274 - Contributed Paper Session (CPS) - Volume 4
P. 274
CPS2222 Abdullah M.R. et al.
4. Numerical Example
The performance of the proposed method has been illustrated in rank-
deficient data. An artificial data with = 20 and = 50 have been considered.
Each variable is generated from normal distribution N (0,1), the good data is
contaminated by replacing three observations (2,4&6) with arbitrary large
numbers equal to 20. The results for Nu-SVR and FP-SVR will be compared to
show the efficiency for the proposed method.
Artificial P=50, n=20 Artificial P=50, n=20
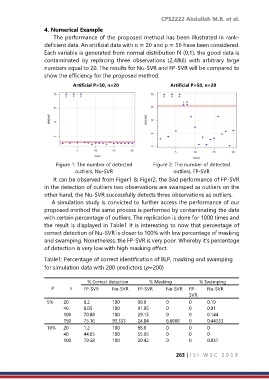
Figure 1: The number of detected Figure 2: The number of detected
outliers, Nu-SVR outliers, FP-SVR
It can be observed from Figer1 & Figer2, the Bad performance of FP-SVR
in the detection of outliers two observations are swamped as outliers on the
other hand, the Nu-SVR successfully detects three observations as outliers.
A simulation study is convicted to further access the performance of our
proposed method the same process is performed by contaminating the data
with certain percentage of outliers, The replication is done for 1000 times and
the result is displayed in Table1 it is interesting to now that percentage of
correct detection of Nu-SVR is closer to 100% with low percentage of masking
and swamping. Nonetheless, the FP-SVR is very poor. Whereby it’s percentage
of detection is very low with high masking effect.
Table1: Percentage of correct identification of BLP, masking and swamping
for simulation data with 200 predictors (p=200)
% Correct detection % Masking % Swamping
n FP-SVR Nu-SVR FP-SVR Nu-SVR FP- Nu-SVR
SVR
5% 20 0.2 100 99.8 0 0 0.19
40 8.05 100 91.95 0 0 0.01
100 70.88 100 29.15 0 0 0.144
150 75.16 93.333 24.84 6.6666 0 0.44333
10% 20 1.2 100 98.8 0 0 0
40 44.05 100 55.95 0 0 0
100 79.58 100 20.42 0 0 0.037
263 | I S I W S C 2 0 1 9