
Page 398 - Contributed Paper Session (CPS) - Volume 4
P. 398
CPS2449 Louisa Nolan et al.
largest ports in the UK. These indicators are likely to be important in
supplementing our understanding of international trade activity. Figure 1
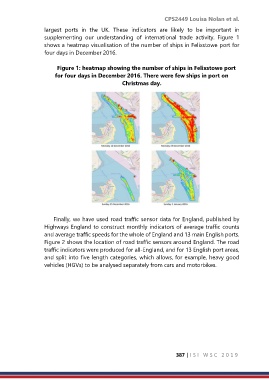
shows a heatmap visualisation of the number of ships in Felixstowe port for
four days in December 2016.
Figure 1: heatmap showing the number of ships in Felixstowe port
for four days in December 2016. There were few ships in port on
Christmas day.
Finally, we have used road traffic sensor data for England, published by
Highways England to construct monthly indicators of average traffic counts
and average traffic speeds for the whole of England and 13 main English ports.
Figure 2 shows the location of road traffic sensors around England. The road
traffic indicators were produced for all-England, and for 13 English port areas,
and split into five length categories, which allows, for example, heavy good
vehicles (HGVs) to be analysed separately from cars and motorbikes.
387 | I S I W S C 2 0 1 9