
Page 401 - Contributed Paper Session (CPS) - Volume 4
P. 401
CPS2449 Louisa Nolan et al.
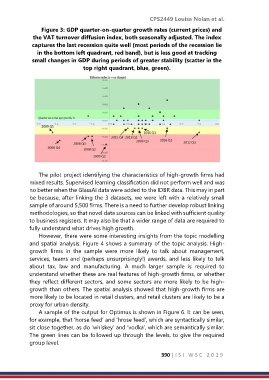
Figure 3: GDP quarter-on-quarter growth rates (current prices) and
the VAT turnover diffusion index, both seasonally adjusted. The index
captures the last recession quite well (most periods of the recession lie
in the bottom left quadrant, red band), but is less good at tracking
small changes in GDP during periods of greater stability (scatter in the
top right quadrant, blue, green).
The pilot project identifying the characteristics of high-growth firms had
mixed results. Supervised learning classification did not perform well and was
no better when the GlassAI data were added to the IDBR data. This may in part
be because, after linking the 3 datasets, we were left with a relatively small
sample of around 5,500 firms. There is a need to further develop robust linking
methodologies, so that novel data sources can be linked with sufficient quality
to business registers. It may also be that a wider range of data are required to
fully understand what drives high growth.
However, there were some interesting insights from the topic modelling
and spatial analysis. Figure 4 shows a summary of the topic analysis. High-
growth firms in the sample were more likely to talk about management,
services, teams and (perhaps unsurprisingly!) awards, and less likely to talk
about tax, law and manufacturing. A much larger sample is required to
understand whether these are real features of high-growth firms, or whether
they reflect different sectors, and some sectors are more likely to be high-
growth than others. The spatial analysis showed that high-growth firms are
more likely to be located in retail clusters, and retail clusters are likely to be a
proxy for urban density.
A sample of the output for Optimus is shown in Figure 6. It can be seen,
for example, that ‘horse feed’ and ‘hrose feed’, which are syntactically similar,
sit close together, as do ‘whiskey’ and ‘vodka’, which are semantically similar.
The green lines can be followed up through the levels, to give the required
group level.
390 | I S I W S C 2 0 1 9