
Page 61 - Contributed Paper Session (CPS) - Volume 4
P. 61
CPS 2126 Dr. Rajkumari Sanatombi Devi et.al
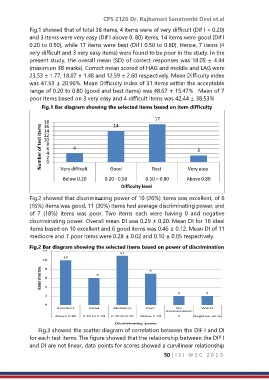
Fig.1 showed that of total 38 items, 4 items were of very difficult (Dif I < 0.20)
and 3 items were very easy (Dif I above 0. 80) items, 14 items were good (Dif I
0.20 to 0.50), while 17 items were best (Dif I 0.50 to 0.80). Hence, 7 items (4
very difficult and 3 very easy items) were found to be poor in the study. In the
present study, the overall mean (SD) of correct responses was 18.05 ± 4.44
(maximum 38 marks). Correct mean scored of HAG and middle and LAG were
23.53 ± 1.77, 18.07 ± 1.48 and 12.59 ± 2.60 respectively. Mean Difficulty index
was 47.53 ± 20.96%. Mean Difficulty index of 31 items within the acceptable
range of 0.20 to 0.80 (good and best items) was 48.67 ± 15.47%. Mean of 7
poor items based on 3 very easy and 4 difficult items was 42.44 ± 38.53%
Fig.1 Bar diagram showing the selected items based on item difficulty
17
18 14
Number of test items 12 4 3
16
14
10
8
6
4
2
0
Good
Very difficult
Very easy
Best
Below 0.20 0.20 - 0.50 0.50 – 0.80 Above 0.80
Difficulty level
Fig.2 showed that discriminating power of 10 (26%) items was excellent, of 6
(16%) items was good, 11 (30%) items had average discriminating power, and
of 7 (18%) items was poor. Two items each were having 0 and negative
discriminating power. Overall mean DI was 0.29 ± 0.20. Mean DI for 16 ideal
items based on 10 excellent and 6 good items was 0.46 ± 0.12. Mean DI of 11
mediocre and 7 poor items were 0.28 ± 0.02 and 0.10 ± 0.05 respectively.
Fig.2 Bar diagram showing the selected items based on power of discrimination
Fig.3 showed the scatter diagram of correlation between the DIF I and DI
for each test items. The figure showed that the relationship between the DIF I
and DI are not linear, data points for scores showed a curvilinear relationship
50 | I S I W S C 2 0 1 9