
Page 62 - Contributed Paper Session (CPS) - Volume 4
P. 62
CPS 2126 Dr. Rajkumari Sanatombi Devi et.al
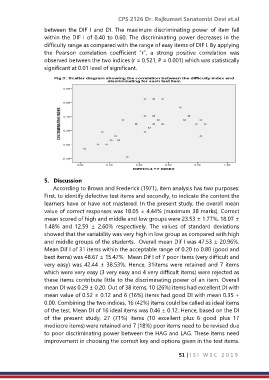
between the DIF I and DI. The maximum discriminating power of item fall
within the DIF I of 0.40 to 0.60. The discriminating power decreases in the
difficulty range as compared with the range of easy items of DIF I. By applying
the Pearson correlation coefficient “r”, a strong positive correlation was
observed between the two indices (r = 0.521, P = 0.001) which was statistically
significant at 0.01 level of significant.
5. Discussion
According to Brown and Frederick (1971), item analysis has two purposes:
First, to identify defective test items and secondly, to indicate the content the
learners have or have not mastered. In the present study, the overall mean
value of correct responses was 18.05 ± 4.44% (maximum 38 marks). Correct
mean scored of high and middle and low groups were 23.53 ± 1.77%, 18.07 ±
1.48% and 12.59 ± 2.60% respectively. The values of standard deviations
showed that the variability was very high in low group as compared with high
and middle groups of the students. Overall mean Dif I was 47.53 ± 20.96%.
Mean Dif I of 31 items within the acceptable range of 0.20 to 0.80 (good and
best items) was 48.67 ± 15.47%. Mean Dif I of 7 poor items (very difficult and
very easy) was 42.44 ± 38.53%. Hence, 31items were retained and 7 items
which were very easy (3 very easy and 4 very difficult items) were rejected as
these items contribute little to the discriminating power of an item. Overall
mean DI was 0.29 ± 0.20. Out of 38 items, 10 (26%) items had excellent DI with
mean value of 0.52 ± 0.12 and 6 (16%) items had good DI with mean 0.35 +
0.00. Combining the two indices, 16 (42%) items could be called as ideal items
of the test. Mean DI of 16 ideal items was 0.46 ± 0.12. Hence, based on the DI
of the present study, 27 (71%) items (10 excellent plus 6 good plus 17
mediocre items) were retained and 7 (18%) poor items need to be revised due
to poor discriminating power between the HAG and LAG. These items need
improvement in choosing the correct key and options given in the test items.
51 | I S I W S C 2 0 1 9