
Page 71 - Contributed Paper Session (CPS) - Volume 4
P. 71
CPS2128 Wlodzimierz Okrasa et al.
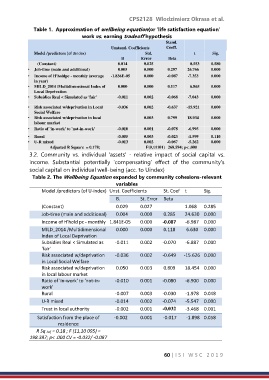
Table 1. Approximation of wellbeing equation(or ‘life satisfaction equation’
work vs. earning tradeoff hypothesis
Stand.
Unstand. Coefficients Coeff.
Model /predictors (of Uindex) Std. t Sig.
B Error Beta
(Constant) 0.014 0.025 0.553 0.580
• Job-time (main and additional) 0.005 0.000 0.297 26.766 0.000
• Income of H'holdpc - monthly (average -1.836E-05 0.000 -0.087 -7.353 0.000
in year)
• MILD_2014 /Multidimensional Index of 0.000 0.000 0.117 6.865 0.000
Local Deprivation
• Subsidies Real < Simulated as 'fair' -0.011 0.002 -0.068 -7.043 0.000
• Risk associated w/deprivation in Local -0.036 0.002 -0.637 -15.921 0.000
Social Welfare
• Risk associated w/deprivation in local 0.003 0.799 18.934 0.000
labour market
• Ratio of 'in-work' to 'not-in-work' -0.010 0.001 -0.078 -6.995 0.000
• Rural -0.005 0.003 -0.023 -1.599 0.110
• U-R mixed -0.013 0.002 -0.067 -5.262 0.000
Adjusted R Square = 0.178; F(9,11101) 268.594; p< .000
3.2. Community vs. individual 'assets' - relative impact of social capital vs.
income. Substantial potentially 'compensating' effect of the community's
social capital on individual well-being (acc. to Uindex)
Table 2. The Wellbeing Equation expanded by community cohesions-relevant
variables
Model /predictors (of U-index) Unst. Coefficients St. Coef t Sig.
B. St. Error Beta
(Constant) 0.029 0.027 1.068 0.285
Job-time (main and additional) 0.004 0.000 0.285 24.630 0.000
Income of H'hold pc - monthly 1.841E-05 0.000 -0.087 -6.987 0.000
MILD_2014 /Multidimensional 0.000 0.000 0.118 6.630 0.000
Index of Local Deprivation
Subsidies Real < Simulated as -0.011 0.002 -0.070 -6.887 0.000
'fair'
Risk associated w/deprivation -0.036 0.002 -0.649 -15.626 0.000
in Local Social Welfare
Risk associated w/deprivation 0.050 0.003 0.809 18.454 0.000
in local labour market
Ratio of 'in-work' to 'not-in- -0.010 0.001 -0.080 -6.900 0.000
work'
Rural -0.007 0.003 -0.030 -1.978 0.048
U-R mixed -0.014 0.002 -0.074 -5.547 0.000
Trust in local authority -0.002 0.001 -0.032 -3.468 0.001
Satisfaction from the place of -0.002 0.001 -0.017 -1.898 0.058
residence
R Sq Adj = 0.18 ; F (11,10 095) =
198.387; p< .000 CV = -0.032/ -0.087
60 | I S I W S C 2 0 1 9