
Page 72 - Contributed Paper Session (CPS) - Volume 4
P. 72
CPS2128 Wlodzimierz Okrasa et al.
3.3. Cross-level relationships - individual and community level factors.
Table 3. Multilevel regression of individual well-being - U-index – on individual
and commune/gmina level variables with cross-level interaction terms.
Model /predictors Weekend
Weekdays /holiday
Beta t Beta t
Constant (.726)** (6.316) (.333)** (3.515)
Education -.085 -1.136 -.089 -1.209
Age -.299** -4.015 -.008 -.105
Multidimensional Index -.098
of Local Deprivation -2.556 -.046 -1.209
/MILD
Education * MILD .142* 1.900 .145* 1.97
Age * MILD .115 1.497 -.029 -.383
Urban (rural omitted) .011 1.280 .016* 1.966
F (6. 22698) = 174.860** F (6. 24 068) =
23.515**
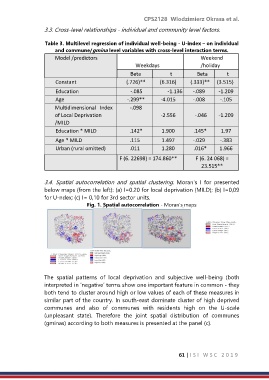
3.4. Spatial autocorrelation and spatial clustering. Moran's I for presented
below maps (from the left): (a) I=0.20 for local deprivation (MILD); (b) I=0,09
for U-ndex; (c) I= 0,10 for 3rd sector units.
Fig. 1. Spatial autocorrelation - Moran's maps
The spatial patterns of local deprivation and subjective well-being (both
interpreted in 'negative' terms show one important feature in common - they
both tend to cluster around high or low values of each of these measures in
similar part of the country. In south-east dominate cluster of high deprived
communes and also of communes with residents high on the U-scale
(unpleasant state). Therefore the joint spatial distribution of communes
(gminas) according to both measures is presented at the panel (c).
61 | I S I W S C 2 0 1 9