
Page 73 - Contributed Paper Session (CPS) - Volume 4
P. 73
CPS2128 Wlodzimierz Okrasa et al.
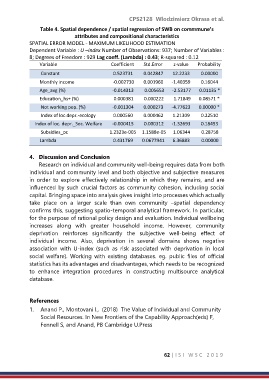
Table 4. Spatial dependence / spatial regression of SWB on commmune’s
attributes and compositional characteristics
SPATIAL ERROR MODEL - MAXIMUM LIKELIHOOD ESTIMATION
Dependent Variable : U –index Number of Observations: 937; Number of Variables :
8; Degrees of Freedom : 929 Lag coeff. (Lambda) : 0.43; R-squared : 0.12
Variable Coefficient Std.Error z-value Probability
Constant 0.523731 0.042847 12.2233 0.00000
Monthly income -0.002730 0.001960 -1.40359 0.16044
Age_avg (%) -0.014313 0.005653 -2.53177 0.01135 *
Education_hs+ (%) 0.000381 0.000222 1.71849 0.08571 *
Not working pop. (%) -0.001304 0.000273 -4.77623 0.00000 *
Index of loc.depr.-ecology 0.000560 0.000462 1.21309 0.22510
Index of loc. depr._Soc. Welfare -0.000415 0.000312 -1.32693 0.18453
Subsidies_pc 1.2323e-005 1.1588e-05 1.06344 0.28758
Lambda 0.431769 0.0677941 6.36883 0.00000
4. Discussion and Conclusion
Research on individual and community well-being requires data from both
individual and community level and both objective and subjective measures
in order to explore effectively relationship in which they remains, and are
influenced by such crucial factors as community cohesion, including social
capital. Bringing space into analysis gives insight into processes which actually
take place on a larger scale than own community –spatial dependency
confirms this, suggesting spatio-temporal analytical framework. In particular,
for the purpose of rational policy design and evaluation. Individual wellbeing
increases along with greater household income. However, community
deprivation reinforces significantly the subjective well-being effect of
individual income. Also, deprivation in several domains shows negative
association with U-index (such as risk associated with deprivation in local
social welfare). Working with existing databases. eg. public files of official
statistics has its advantages and disadvantages, which needs to be recognized
to enhance integration procedures in constructing multisource analytical
database.
References
1. Anand P., Montovani I., (2018) The Value of Individual and Community
Social Resources. In New Frontiers of the Capability Approach(eds) F,
Fennell S, and Anand, PB Cambridge U.Press
62 | I S I W S C 2 0 1 9