
Page 86 - Contributed Paper Session (CPS) - Volume 4
P. 86
CPS2131 Philip L.H. Yu et al.
(Smith et al., 2004; Woolrich et al., 2009). Besides imaging data, it also involves
the structural data such as patients’ side of limb weakness at A & E admission.
The CT images have similar quality, spatial resolution and field- of-view.
The in-plane resolution is 0.426*0.426 mm. The slice thickness is 5.0 mm for
all cases, and the number of slices is around 26 to 32. Each axial slice has
identical resolutions of 512*512.
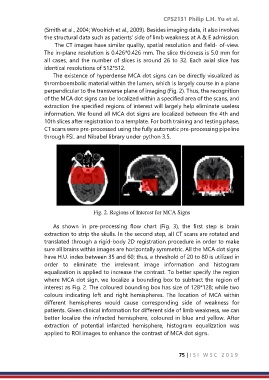
The existence of hyperdense MCA dot signs can be directly visualized as
thromboembolic material within the lumen, which is largely course in a plane
perpendicular to the transverse plane of imaging (Fig. 2). Thus, the recognition
of the MCA dot signs can be localized within a specified area of the scans, and
extraction the specified regions of interest will largely help eliminate useless
information. We found all MCA dot signs are localized between the 4th and
10th slices after registration to a template. For both training and testing phase,
CT scans were pre-processed using the fully automatic pre-processing pipeline
through FSL and Nibabel library under python 3.5.
Fig. 2. Regions of Interest for MCA Signs
As shown in pre-processing flow chart (Fig. 3), the first step is brain
extraction to strip the skulls. In the second step, all CT scans are rotated and
translated through a rigid-body 2D registration procedure in order to make
sure all brains within images are horizontally symmetric. All the MCA dot signs
have H.U. index between 35 and 60; thus, a threshold of 20 to 80 is utilized in
order to eliminate the irrelevant image information and histogram
equalization is applied to increase the contrast. To better specify the region
where MCA dot sign, we localize a bounding box to subtract the region of
interest as Fig. 2. The coloured bounding box has size of 128*128; while two
colours indicating left and right hemispheres. The location of MCA within
different hemispheres would cause corresponding side of weakness for
patients. Given clinical information for different side of limb weakness, we can
better localize the infracted hemisphere, coloured in blue and yellow. After
extraction of potential infarcted hemisphere, histogram equalization was
applied to ROI images to enhance the contrast of MCA dot signs.
75 | I S I W S C 2 0 1 9