
Page 117 - Contributed Paper Session (CPS) - Volume 7
P. 117
CPS2043 Adnan Dawood K. B. et al.
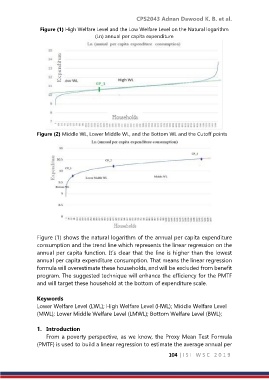
Figure (1) High Welfare Level and the Low Welfare Level on the Natural logarithm
(Ln) annual per capita expenditure
Figure (2) Middle WL, Lower Middle WL, and the Bottom WL and the Cutoff points
Figure (1) shows the natural logarithm of the annual per capita expenditure
consumption and the trend line which represents the linear regression on the
annual per capita function. It’s clear that the line is higher than the lowest
annual per capita expenditure consumption. That means the linear regression
formula will overestimate these households, and will be excluded from benefit
program. The suggested technique will enhance the efficiency for the PMTF
and will target these household at the bottom of expenditure scale.
Keywords
Lower Welfare Level (LWL); High Welfare Level (HWL); Middle Welfare Level
(MWL); Lower Middle Welfare Level (LMWL); Bottom Welfare Level (BWL);
1. Introduction
From a poverty perspective, as we know, the Proxy Mean Test Formula
(PMTF) is used to build a linear regression to estimate the average annual per
104 | I S I W S C 2 0 1 9