
Page 119 - Contributed Paper Session (CPS) - Volume 7
P. 119
CPS2043 Adnan Dawood K. B. et al.
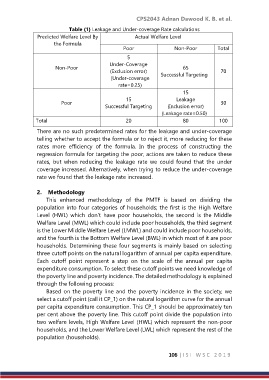
Table (1) Leakage and Under-coverage Rate calculations
Predicted Welfare Level By Actual Welfare Level
the Formula
Poor Non-Poor Total
5
Under-Coverage
Non-Poor (Exclusion error) 65 70
Successful Targeting
(Under-coverage
rate=0.25)
15
15 Leakage
Poor 30
Successful Targeting (Inclusion error)
(Leakage rate=0.50)
Total 20 80 100
There are no such predetermined rates for the leakage and under-coverage
telling whether to accept the formula or to reject it, more reducing for these
rates more efficiency of the formula. In the process of constructing the
regression formula for targeting the poor, actions are taken to reduce these
rates, but when reducing the leakage rate we could found that the under
coverage increased. Alternatively, when trying to reduce the under-coverage
rate we found that the leakage rate increased.
2. Methodology
This enhanced methodology of the PMTF is based on dividing the
population into four categories of households; the first is the High Welfare
Level (HWL) which don’t have poor households, the second is the Middle
Welfare Level (MWL) which could include poor households, the third segment
is the Lower Middle Welfare Level (LMWL) and could include poor households,
and the fourth is the Bottom Welfare Level (BWL) in which most of it are poor
households. Determining these four segments is mainly based on selecting
three cutoff points on the natural logarithm of annual per capita expenditure.
Each cutoff point represent a step on the scale of the annual per capita
expenditure consumption. To select these cutoff points we need knowledge of
the poverty line and poverty incidence. The detailed methodology is explained
through the following process:
Based on the poverty line and the poverty incidence in the society, we
select a cutoff point (call it CP_1) on the natural logarithm curve for the annual
per capita expenditure consumption. This CP_1 should be approximately ten
per cent above the poverty line. This cutoff point divide the population into
two welfare levels, High Welfare Level (HWL) which represent the non‐poor
households, and the Lower Welfare Level (LWL) which represent the rest of the
population (households).
106 | I S I W S C 2 0 1 9