
Page 143 - Contributed Paper Session (CPS) - Volume 7
P. 143
CPS2048 Md Zobaer H. et al.
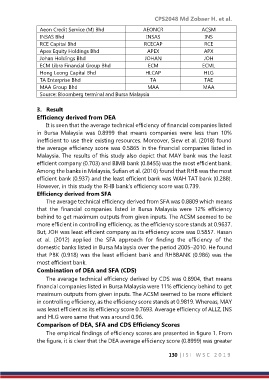
Aeon Credit Service (M) Bhd AEONCR ACSM
INSAS Bhd INSAS INS
RCE Capital Bhd RCECAP RCE
Apex Equity Holdings Bhd APEX APX
Johan Holdings Bhd JOHAN JOH
ECM Libra Financial Group Bhd ECM ECML
Hong Leong Capital Bhd HLCAP HLG
TA Enterprise Bhd TA TAE
MAA Group Bhd MAA MAA
Source: Bloomberg terminal and Bursa Malaysia
3. Result
Efficiency derived from DEA
It is seen that the average technical efficiency of financial companies listed
in Bursa Malaysia was 0.8999 that means companies were less than 10%
inefficient to use their existing resources. Moreover, Siew et al. (2018) found
the average efficiency score was 0.5865 in the financial companies listed in
Malaysia. The results of this study also depict that MAY bank was the least
efficient company (0.703) and BIMB bank (0.8455) was the most efficient bank.
Among the banks in Malaysia, Sufian et al. (2016) found that RHB was the most
efficient bank (0.937) and the least efficient bank was WAH TAT bank (0.288).
However, in this study the RHB bank’s efficiency score was 0.739.
Efficiency derived from SFA
The average technical efficiency derived from SFA was 0.8809 which means
that the financial companies listed in Bursa Malaysia were 12% efficiency
behind to get maximum outputs from given inputs. The ACSM seemed to be
more efficient in controlling efficiency, as the efficiency score stands at 0.9637.
But, JOH was least efficient company as its efficiency score was 0.5857. Hasan
et al. (2012) applied the SFA approach for finding the efficiency of the
domestic banks listed in Bursa Malaysia over the period 2005–2010. He found
that PBK (0.918) was the least efficient bank and RHBBANK (0.986) was the
most efficient bank.
Combination of DEA and SFA (CDS)
The average technical efficiency derived by CDS was 0.8904, that means
financial companies listed in Bursa Malaysia were 11% efficiency behind to get
maximum outputs from given inputs. The ACSM seemed to be more efficient
in controlling efficiency, as the efficiency score stands at 0.9819. Whereas, MAY
was least efficient as its efficiency score 0.7693. Average efficiency of ALLZ, INS
and HLG were same that was around 0.96.
Comparison of DEA, SFA and CDS Efficiency Scores
The empirical findings of efficiency scores are presented in figure 1. From
the figure, it is clear that the DEA average efficiency score (0.8999) was greater
130 | I S I W S C 2 0 1 9