
Page 176 - Contributed Paper Session (CPS) - Volume 7
P. 176
CPS2055 Asanao S. et al.
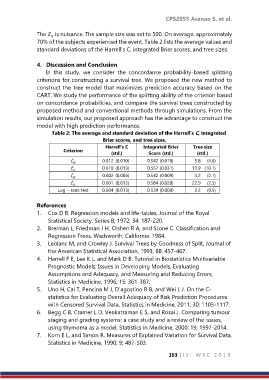
The is nuisance. The sample size was set to 500. On average, approximately
4
70% of the subjects experienced the event. Table 2 lists the average values and
standard deviations of the Harrell’s C, integrated Brier scores, and tree sizes.
4. Discussion and Conclusion
In this study, we consider the concordance probability-based splitting
criterions for constructing a survival tree. We proposed the new method to
construct the tree model that maximizes prediction accuracy based on the
CART. We study the performance of the splitting ability of the criterion based
on concordance probabilities, and compare the survival trees constructed by
proposed method and conventional methods through simulations. From the
simulation results, our proposed approach has the advantage to construct the
model with high prediction performance.
Table 2: The average and standard deviation of the Harrell’s C, integrated
Brier scores, and tree sizes.
Harrell’s C Integrated Brier Tree size
Criterion (std.) Score (std.) (std.)
̂ 0.612 (0.010) 0.542 (0.018) 5.8 (4.6)
̂ 0.610 (0.013) 0.557 (0.031) 11.9 (10.1)
̂ 0.602 (0.006) 0.542 (0.009) 4.2 (2.1)
̂ 0.601 (0.013) 0.584 (0.020) 22.9 (2.3)
Log rank test 0.604 (0.013) 0.539 (0.009) 2.2 (0.5)
References
1. Cox D R. Regression models and life-tables, Journal of the Royal
Statistical Society: Series B, 1972; 34: 187-220.
2. Breiman L, Friedman J H, Olshen R A, and Stone C. Classification and
Regression Trees. Wadsworth, California. 1984.
3. Leblanc M, and Crowley J. Survival Trees by Goodness of Split, Journal of
the American Statistical Association, 1993; 88: 457-467.
4. Harrell F E, Lee K L, and Mark D B. Tutorial in Biostatistics Multivariable
Prognostic Models: Issues in Developing Models, Evaluating
Assumptions and Adequacy, and Measuring and Reducing Errors,
Statistics in Medicine, 1996; 15: 361-387.
5. Uno H, Cai T, Pencina M J, D’agostino R B, and Wei L J. On the C-
statistics for Evaluating Overall Adequacy of Risk Prediction Procedures
with Censored Survival Data, Statistics in Medicine, 2011; 30: 1105-1117.
6. Begg C B, Cramer L D, Venkatraman E S, and Rosai J. Comparing tumour
staging and grading systems: a case study and a review of the issues,
using thymoma as a model, Statistics in Medicine, 2000; 19; 1997-2014.
7. Korn E L, and Simon R. Measures of Explained Variation for Survival Data,
Statistics in Medicine, 1990; 9; 487-503.
163 | I S I W S C 2 0 1 9