
Page 264 - Contributed Paper Session (CPS) - Volume 7
P. 264
CPS2084 Siti Aisyah Mohd Padzil et al.
where, N is the total number of sample, is the actual value of dependent
variables and ̂ is the estimated value of Y.
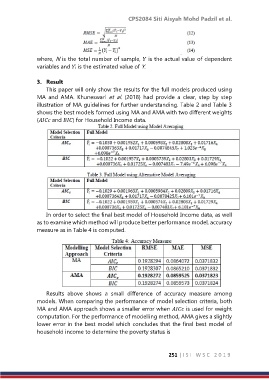
3. Result
This paper will only show the results for the full models produced using
MA and AMA. Khuneswari et al. (2018) had provide a clear, step by step
illustration of MA guidelines for further understanding. Table 2 and Table 3
shows the best models formed using MA and AMA with two different weights
( and ) for Household Income data.
In order to select the final best model of Household Income data, as well
as to examine which method will produce better performance model, accuracy
measure as in Table 4 is computed.
Results above shows a small difference of accuracy measure among
models. When comparing the performance of model selection criteria, both
MA and AMA approach shows a smaller error when is used for weight
computation. For the performance of modelling method, AMA gives a slightly
lower error in the best model which concludes that the final best model of
household income to determine the poverty status is
251 | I S I W S C 2 0 1 9