
Page 304 - Contributed Paper Session (CPS) - Volume 7
P. 304
CPS2105 Hermansah et al.
X ̂ N+h = [φ(B) − 1]S ̃ J 0 ,N+h + θ(B)e N+h + ∑ J 0 ([φ j (B) − 1]D ̃ j,N+h + θ j (B)e N+h ) (15)
j=0
3. Result
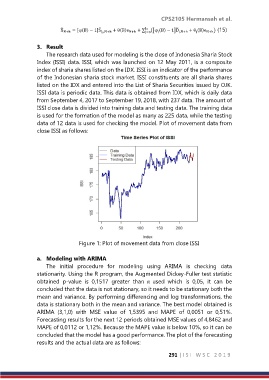
The research data used for modeling is the close of Indonesia Sharia Stock
Index (ISSI) data. ISSI, which was launched on 12 May 2011, is a composite
index of sharia shares listed on the IDX. ISSI is an indicator of the performance
of the Indonesian sharia stock market. ISSI constituents are all sharia shares
listed on the IDX and entered into the List of Sharia Securities issued by OJK.
ISSI data is periodic data. This data is obtained from IDX, which is daily data
from September 4, 2017 to September 19, 2018, with 237 data. The amount of
ISSI close data is divided into training data and testing data. The training data
is used for the formation of the model as many as 225 data, while the testing
data of 12 data is used for checking the model. Plot of movement data from
close ISSI as follows:
Figure 1: Plot of movement data from close ISSI
a. Modeling with ARIMA
The initial procedure for modeling using ARIMA is checking data
stationarity. Using the R program, the Augmented Dickey-Fuller test statistic
obtained p-value is 0,1517 greater than α used which is 0,05, it can be
concluded that the data is not stationary, so it needs to be stationary both the
mean and variance. By performing differencing and log transformations, the
data is stationary both in the mean and variance. The best model obtained is
ARIMA (3,1,0) with MSE value of 1,5395 and MAPE of 0,0051 or 0,51%.
Forecasting results for the next 12 periods obtained MSE values of 4,8462 and
MAPE of 0,0112 or 1,12%. Because the MAPE value is below 10%, so it can be
concluded that the model has a good performance. The plot of the forecasting
results and the actual data are as follows:
291 | I S I W S C 2 0 1 9