
Page 73 - Contributed Paper Session (CPS) - Volume 7
P. 73
CPS2031 Javier Linkolk L. et al.
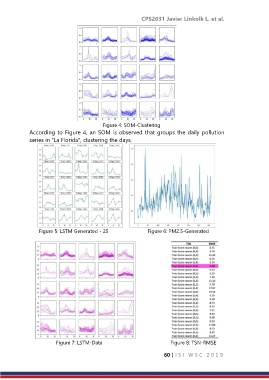
Figure 4: SOM‐Clustering
According to Figure 4, an SOM is observed that groups the daily pollution
series in "La Florida", clustering the days.
Figure 5: LSTM Generated ‐ 25 Figure 6: PM2.5‐Generated
Figure 7: LSTM‐Data Figure 8: TSN‐RMSE
60 | I S I W S C 2 0 1 9