Page 131 - Contributed Paper Session (CPS) - Volume 6
P. 131

CPS1848 J.A. Roldán-Nofuentes et al.
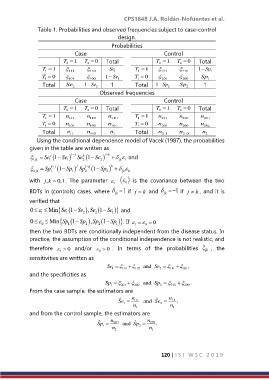
                Table 1. Probabilities and observed frequencies subject to case-control
                                              design.
                                            Probabilities
                              Case                              Control
                         T  1   T  0    Total              T  1   T  0    Total
                                                              2
                          2
                                   2
                                                                      2
                 T  1                   Se        T  1                 1 Sp
                                                                              
                  1        111     110       1        1        211     210        1
                 T   0     101          1 Se       T  0     201     200     Sp
                                           
                                                                                 1
                                              1
                                                      1
                  1
                                   100
                                                              
                                   
                 Total    Se     1 Se       1        Total   1 Sp     Sp       1
                                      2
                                                                         2
                             2
                                                                 2
                                       Observed frequencies
                              Case                              Control
                         T  1   T  0    Total              T  1   T  0    Total
                          2
                                                                      2
                                   2
                                                              2
                 T  1    n 111     n 110    n 11        T  1   n 211    n 210     n 21
                                                      1
                  1
                 T   0    n      n       n          T  0    n       n       n
                  1        101     100      10        1        201     200     20
                 Total     n      n 1 0    n         Total    n 2 1    n 2 0    n
                            1 1
                                                                                2
                                            1
               Using the conditional dependence model of Vacek (1987), the probabilities
            given in the table are written as
                             
                                          
              1 jk    Se 1 j 1 Se 1  1 j Se k 2  1 Se 2  1 k      and
                       
                                    
                                                 1
                                               jk
                                            k
                              j
                                      
              2 jk   Sp 1 j 1 Sp 1  Sp 1 k 1 Sp 2    
                         
                     
                                  
                    1
                                                jk
                                                  0
                                  2
                                                
            with  , j k  0,1.  The  parameter       is  the  covariance  between  the  two
                                             1   0
            BDTs in (controls) cases, where    if  j   and     1 if  j  , and it is
                                                1
                                                                            k
                                                        k
                                             jk
                                                                jk
            verified that
                             
             0    Min Se 1 1 Se 2 ,Se 2 1 Se 1  and
              
                                         
                 1
                              
                                          
             0    Min Sp 1 1 Sp 2 ,Sp 2 1 Sp 1 . If   1     0    0
              
                 0
            then the two BDTs are conditionally independent from the disease status. In
            practice, the assumption of the conditional independence is not realistic, and
            therefore     0  and/or    0 .  In  terms  of  the  probabilities   ijk ,  the
                        1              0
            sensitivities are written as
                                          Se   111      and  Se   111    ,
                                                              2
                                                     110
                                                                       101
                                            1
            and the specificities as
                                         Sp          and  Sp       .
                                           1   201   200      2    210  200
            From the case sample, the estimators are
                                              Se   ˆ  n 11    and  Se   ˆ  n 1 1  ,
                                                1              2
                                                    n 1           n 1
            and from the control sample, the estimators are
                                      Sp   ˆ  n 20    and  Sp   ˆ  n 2 0  ,
                                        1
                                            n         2   n
                                             2             1
                                                               120 | I S I   W S C   2 0 1 9
   126   127   128   129   130   131   132   133   134   135   136