
Page 401 - Contributed Paper Session (CPS) - Volume 6
P. 401
CPS1995 Daniel B. et al.
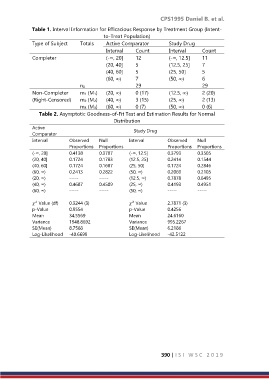
Table 1. Interval Information for Efficacious Response by Treatment Group (Intent-
to-Treat Population)
Type of Subject Totals Active Comparator Study Drug
Interval Count Interval Count
Completer (-∞, 20] 12 (-∞, 12.5] 11
(20, 40] 5 (12.5, 25] 7
(40, 60] 5 (25, 50] 5
(60, ∞) 7 (50, ∞) 6
n0 29 29
Non-Completer m1 (M1) (20, ∞) 0 (17) (12.5, ∞) 2 (20)
(Right-Censored) m2 (M2) (40, ∞) 3 (15) (25, ∞) 2 (13)
m3 (M3) (60, ∞) 0 (7) (50, ∞) 0 (6)
Table 2. Asymptotic Goodness-of-Fit Test and Estimation Results for Normal
Distribution
Active Study Drug
Comparator
Interval Observed Null Interval Observed Null
Proportions Proportions Proportions Proportions
(-∞, 20] 0.4138 0.3707 (-∞, 12.5] 0.3793 0.3505
(20, 40] 0.1724 0.1783 (12.5, 25] 0.2414 0.1544
(40, 60] 0.1724 0.1687 (25, 50] 0.1724 0.2846
(60, ∞) 0.2413 0.2822 (50, ∞) 0.2069 0.2105
(20, ∞) ----- ----- (12.5, ∞) 0.7878 0.6495
(40, ∞) 0.4687 0.4509 (25, ∞) 0.4193 0.4951
(60, ∞) ----- ----- (50, ∞) ----- -----
2
2
Value (df) 0.3244 (3) Value 2.7871 (3)
p-Value 0.9554 p-Value 0.4256
Mean 34.5569 Mean 24.6160
Variance 1948.8692 Variance 995.2267
SE(Mean) 8.7568 SE(Mean) 6.2186
Log-Likelihood -40.6699 Log-Likelihood -42.5122
390 | I S I W S C 2 0 1 9