
Page 427 - Contributed Paper Session (CPS) - Volume 6
P. 427
CPS2008 Syafrina A.H et al.
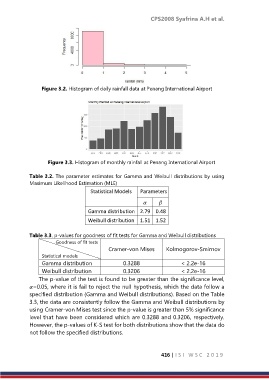
Figure 3.2. Histogram of daily rainfall data at Penang International Airport
Figure 3.3. Histogram of monthly rainfall at Penang International Airport
Table 3.2. The parameter estimates for Gamma and Weibull distributions by using
Maximum Likelihood Estimation (MLE)
Statistical Models Parameters
Gamma distribution 2.79 0.48
Weibull distribution 1.51 1.52
Table 3.3. p-values for goodness of fit tests for Gamma and Weibull distributions
Goodness of fit tests
Cramer-von Mises Kolmogorov-Smirnov
Statistical models
Gamma distribution 0.3288 < 2.2e-16
Weibull distribution 0.3206 < 2.2e-16
The p-value of the test is found to be greater than the significance level,
=0.05, where it is fail to reject the null hypothesis, which the data follow a
specified distribution (Gamma and Weibull distributions). Based on the Table
3.3, the data are consistently follow the Gamma and Weibull distributions by
using Cramer-von Mises test since the p-value is greater than 5% significance
level that have been considered which are 0.3288 and 0.3206, respectively.
However, the p-values of K-S test for both distributions show that the data do
not follow the specified distributions.
416 | I S I W S C 2 0 1 9